Apartment List Methodology Revamp

Apartment List is committed to making our rent estimates the best and most accurate available, and as part of our efforts toward that goal, we’ve made some changes to our methodology__. Below you'll find answers to frequently asked questions about Apartment List's new rent report methodology. You can read more about our new methodology here and access rent data by city here.
1. Why are your rent estimates so much lower than estimates from other private listing websites?
The estimates published by most private listing companies are based on the listings on those companies’ sites. The problem is that these listings include more expensive, newer, luxury apartments in trendy neighborhoods, pushing median rent prices upwards.
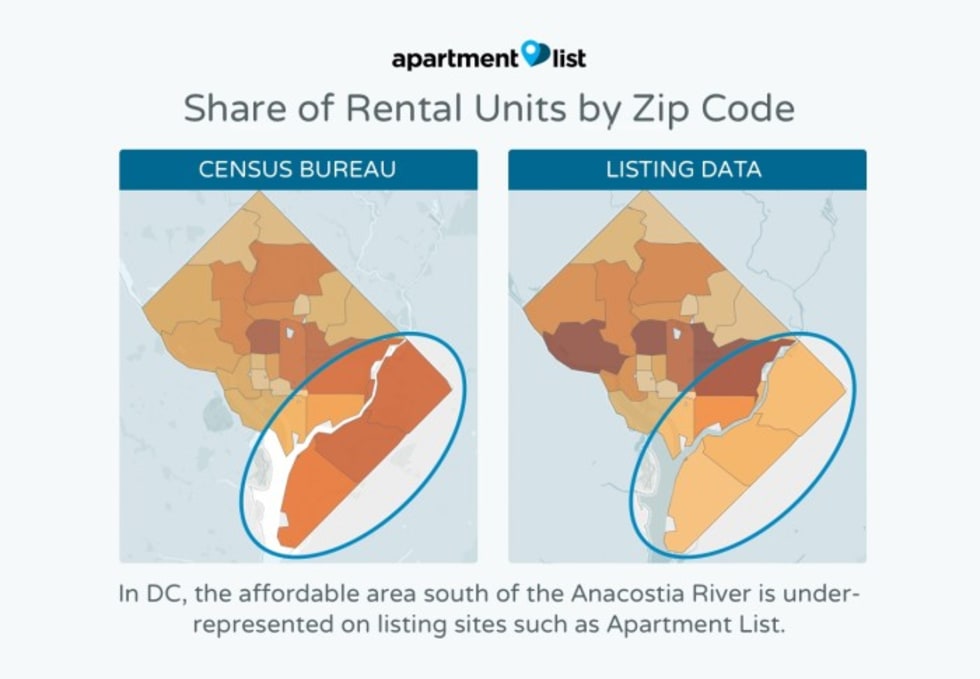
Looking at the results for DC, for example, private listing companies report median two-bedroom rents of $3,000 to $3,050, but the Census median two-bedroom rent from 2015 was only $1,347. If private listing companies numbers are to be believed, this would mean that rents in DC increased by ~125% in less than two years!
In contrast, our new estimates use data collected by Census through the American Community Survey (ACS), which takes a broad representative sample of the population. This data is free of the bias found in listing data and includes units of all types and qualities, across all parts of the city. Our data includes rents for older units with fewer amenities, as well as rents from lower-income neighborhoods, which results in lower rent estimates. We believe our new methodology captures a full picture of a city’s rental market, instead of just focusing on the high-end.
2. Your rent estimates seem low for some cities. Do they include Section 8 housing or rent-controlled properties?
Our rent estimates do not include rent-controlled units, rental units considered substandard in quality, seasonal rentals, or public housing units.
3. Why are rents in some expensive core cities cheaper than those in surrounding suburbs?
It’s true that one feature of our new methodology is that estimates for a few core cities are cheaper than some surrounding suburbs. This can occur for a couple of reasons. For one, the type of rental inventory available often differs from the core city to the suburbs. For example, in the core city, most two-bedroom units are apartments, while in the surrounding suburbs, many of those units may be single-family homes with additional amenities, such as increased square footage or parking. Additionally, suburbs tend to be smaller and more homogenous, making the distribution of rents more closely clustered around the median. By contrast, core cities tend to have pockets of neighborhoods with expensive luxury units or less-expensive apartments with older, lower-rent buildings, pulling the median downward.
4. Does your data only include apartments or does it also include single-family homes that are for rent?
Our base rent estimates begin with Census rental data which includes data from all renters in the U.S. This data includes properties ranging from large multifamily buildings to single-family homes. We then extrapolate forward using price change data from the millions of properties listed on ApartmentList.com. While many of the units on our site are large multifamily properties, we also obtain data on smaller properties and single-family homes. Additionally, by using rent data from the Census, we capture average rents that are representative of all types of rentals, not just apartments.
5. How do you calculate price change for your month-over-month and year-over-year rent estimates?
Our price change index is calculated on a same-unit basis similar to the Case-Shiller home price index. This calculation looks at price changes for units that are available across time periods, matching on street address, bedroom size, and square footage (within 50 feet). We calculate price change at the unit level, and then we take the average change for all units within a given geography.
**a. How does your approach to calculating price changes control for the fact that expensive units are more likely to stay on the market longer and experience future price cuts (i.e. survivorship bias)?**
To control for this bias, our price change calculation does not directly compare prices from one month to the next, but, instead, it makes a comparison to a base month at least three months prior. For example, for June estimates, we use a base month of January. This means that we calculate the same-unit price change from January to May and from January to June, and then we take the difference of those two values to infer the change from May to June. This approach is meant to ensure that we’re comparing repeat listings of similar units, rather than looking only at units that have remained on the market for multiple months.
**b. If price changes are calculated from your listing data, don’t those estimates still suffer from luxury bias?**
It’s true that our price change component of our rent estimates does not control for bias in the inventory mix of our listings. For example, if rents are growing faster at the low-end of the market than at the high-end, we would tend to underestimate growth. We are aware of this is a limitation and plan to address it in the future. That said, the luxury bias in our listings has more of an impact on the level of rents, where we control for it, then it does on rent growth.
6. If you use Census and HUD data for your rent estimates, why wouldn’t we just use their rent data?
While the Census and HUD provide accurate data, they release their data with a long time lag. Census data, collected from the American Community Survey, provides unbiased and accurate rent estimates but this data is released with a one year or two-year time lag and covers all renters, not just those paying market rents.
Meanwhile, HUD publishes annual data based on Census estimates, adjusted to account for recent movers and inflation. While HUD data provides a rough estimate for current market rents each year, their adjustment factor is based on a rough forecast for rent growth nationwide and is still released with a time lag.
In contrast, our methodology relies on accurate Census and HUD estimates but adjusts for real metro specific trends in the rental market, rather than the rough national trend used by HUD. This allows us to provide up-to-date rental data without the time lag of the Census and HUD and with metro-specific growth trends.
7. What makes your approach different from estimates published by your competitors?
Many private companies release rent estimates based on their property listings, but these private data sources skew towards luxury properties and more popular neighborhoods. By starting with reliable Census data that covers all rentals, we are able to correct for the sample bias inherent to private rental listing sites. We then adjust for metro specific rent growth to provide rent estimates that are both timely and accurate. Additionally, because we use ACS and HUD data as a base, we are able to combine public data for past years with current extrapolated data to provide a picture of long-term rent growth.
Share this Article
