Best Metros for College Graduates in 2020

For recent graduates, choosing where to move after college is the first big (and exciting) decision to make as new members of the “real world.” Graduates can take any number of paths. They may move to a city to pursue a particular career, or to another to be closer to friends, family, and loved ones. They may pick a city because it’s affordable enough to start a family, or simply because they like the weather. Recent college grads are highly sought-after in the workplace and have the flexibility to live in many places before deciding where to settle down. In normal circumstances, their options abound.
But for the Class of 2020, circumstances are anything but normal. While previous classes spent May looking at a map, excited about where to move or travel, this year’s graduates are uncertain if moving is a good idea or if there are any jobs out there waiting for them.
The coronavirus pandemic has fundamentally altered what constitutes a “best city” for recent college graduates, so we’ve compiled the data that’s relevant in 2020 to learn which cities today’s grads should have on their radar.
Methodology
We designed this year’s index with the coronavirus pandemic in mind. In the past, we determined the best metros for recent grads using a blend of economic and lifestyle variables; the goal was to find places where young professionals could not only establish a healthy career but also enjoy fun, fulfilling social lives.
This summer, with social life essentially shut down and with so much apprehension focused on the job market, social and lifestyle factors have been removed from the index altogether.1 Amid the shifting priorities of these extreme circumstances, we’ve decided to focus our analysis solely on finding the places where recent college graduates have the best opportunities to secure a job and weather the economic storm.
Therefore, our 2020 index consists of six equally-weighted economic factors.2
Opportunity
Factors 1-3 focus on opportunity: which markets have lower unemployment and provide good-paying jobs that allow young professionals to afford living on their own?
- The average wage among recent college grads3
- The March unemployment rate4
- The cost burden rate among recent college graduates who rent5
Resilience
Factors 4-6 focus on resilience: which markets are least-disrupted by the “quarantine economy” and will be able to bounce back quickest once the national economy starts to recover?
- The percentage of the adult population with a college degree6
- The percentage of recent college grads working in occupations amenable to remote work7
- The percentage of the region’s labor force working in “high-risk” occupations8
Key Findings
After analyzing the rankings based off of our six economic factors, a few key trends emerged.
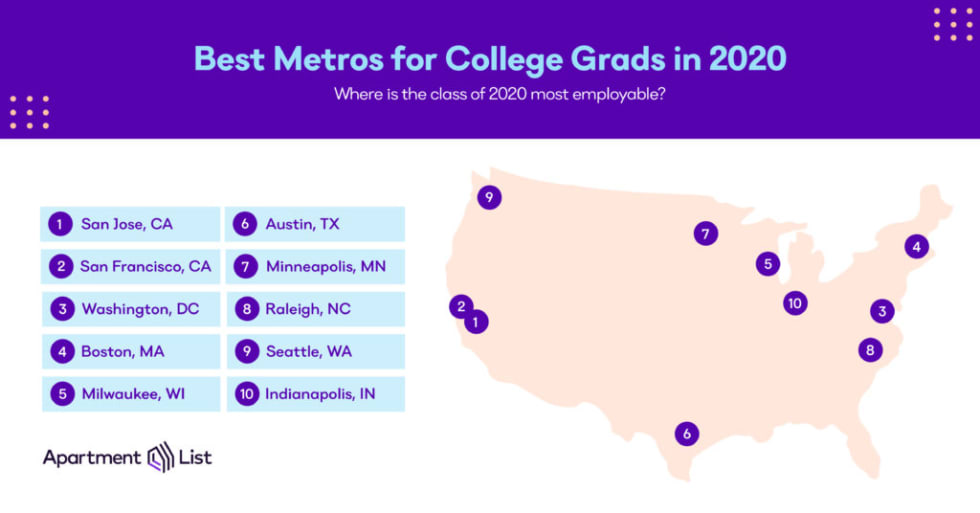
Bay Area Supremacy: At the top of the list are the San Francisco Bay Area’s two major metropolitan areas: San Jose (#1) and San Francisco (#2). Despite the high price of real estate in this region, powerful economies make it an attractive home for new graduates. Here there is a concentration of high-paying jobs that lend themselves to remote work environments, so young professionals can secure a good job even if they must also shelter-in-place.
Strong Performance from Midwest Metros: Three mid-sized midwestern metros make the Top 10: Milwaukee (#5), Minneapolis (#7), and Indianapolis (#10). While these metros don’t command the highest salaries, they offer affordable housing options and well-rounded economies driven by essential industries.
A Lack of Mega-Metros: Each of the nation’s five largest metropolitan areas—New York, Los Angeles, Chicago, Dallas, and Houston—failed to break the Top 10. The Class of 2020 is better off looking into smaller regions that strike a healthier balance between affordability and economic opportunity.
10. Indianapolis, IN

- The total population in Indianapolis, IN: 876,384
- Percentage of the population between 20 - 29 years old in Indianapolis, IN: 16%
- Average age: 34.3 years old
- Percentage of the population with a bachelor’s degree in Indianapolis, IN: 30.9%
- Median earnings for bachelor degree holders in Indianapolis, IN: $52,542
- Top industries in Indianapolis, IN: Healthcare, Insurance
- Average commute time to work in Indianapolis, IN: 23.2 minutes
- Average one-bedroom apartment rent in Indianapolis, IN: $838/month
- Cost of living in Indianapolis, IN: 8% lower than the national average
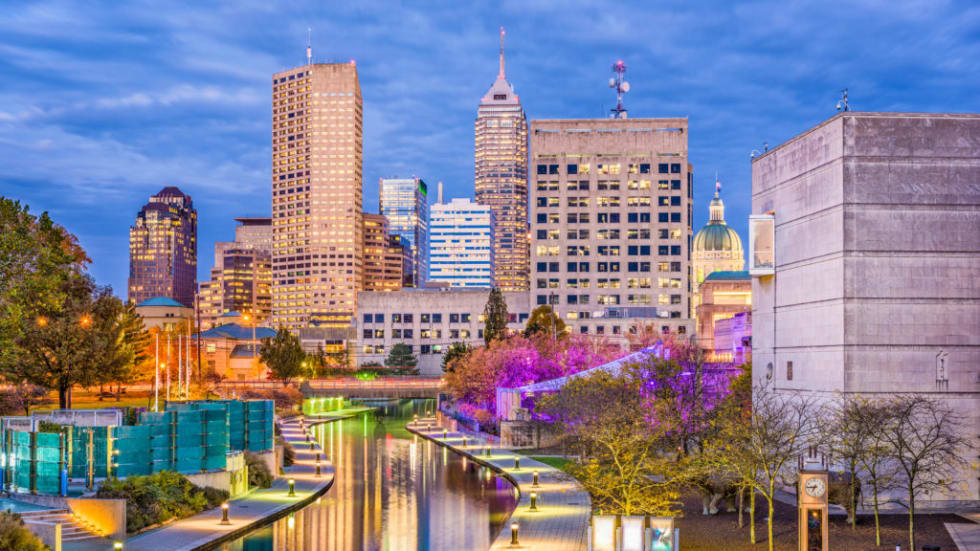
Taking the #10 spot is Indianapolis, IN. When it comes to affordability and employment rates, this Midwestern metropolis is top-notch. Even as unemployment spikes, Indianapolis maintained the 3rd lowest unemployment rate in March (3 percent) as well as the 3rd lowest cost-burden rate among recent college graduates who rent (26 percent). So while Indianapolis’s wages might not be as competitive as other cities on our list, relatively low rents keep the city affordable.
With a low cost-of-living and unemployment rate, a high job satisfaction rate, and a huge sports following (go Colts!), you’ll likely find Indy is worth braving the Midwestern winters. Locals affectionately refer to Indianapolis as the “goldilocks city”, meaning it’s not too big nor too small, but just right.

9. Seattle, WA

- The total population in Seattle, WA: 753,675
- Percentage of the population between 20 - 29 years old in Seattle, WA: 21%
- Average age: 34.5 years old
- Percentage of the population with a bachelor’s degree in Seattle, WA: 64%
- Median earnings for bachelor degree holders in Seattle, WA: $58,952
- Top industries in Seattle, WA: Clean Energy, Aerospace & Defense, Life Sciences
- Average commute time to work in Seattle, WA: 27.5 minutes
- Average one-bedroom apartment rent in Seattle, WA: $1,400/month
- Cost of living in Seattle, WA: 49% higher than the national average
Seattle, WA comes in as the 9th best metro for college graduates, and it’s easy to see why. Seattle’s booming tech scene lends itself to being a wonderful place for a college graduate to start their careers, particularly those who earned degrees in STEM fields. Seattle’s recent college graduates earn over $56,000 on average, 3rd highest in the nation. And because of this high concentration of technology-focused jobs, many Seattleites can work from home, helping them weather the COVID quarantine.
If you have your heart set on the Emerald City, keep an eye out for jobs at tech giants like Amazon and Microsoft, both of which are headquartered in the area. Just know that while your salary may be high, you should plan to spend a good chunk of it on rent. That said, many residents find that Seattle’s food scene, outdoor recreation, and unique culture more than justify the cost.
Learn more about things you should know before moving to Seattle!
8. Raleigh, NC

- The total population in Raleigh, NC: 474,069
- Percentage of the population between 20 - 29 years old in Raleigh, NC: 18%
- Average age: 34.5 years old
- Percentage of the population with a bachelor’s degree in Raleigh, NC: 50.9%
- Median earnings for bachelor degree holders in Raleigh, NC: $58,196
- Top industries in Raleigh, NC: Clean Technology, Advanced Manufacturing, IT/Technology, Life Sciences
- Average commute time to work in Raleigh, NC: 26.4 minutes
- Average one-bedroom apartment rent in Raleigh, NC: $1,095/month
- Cost of living in Raleigh, NC: 5% lower than the national average
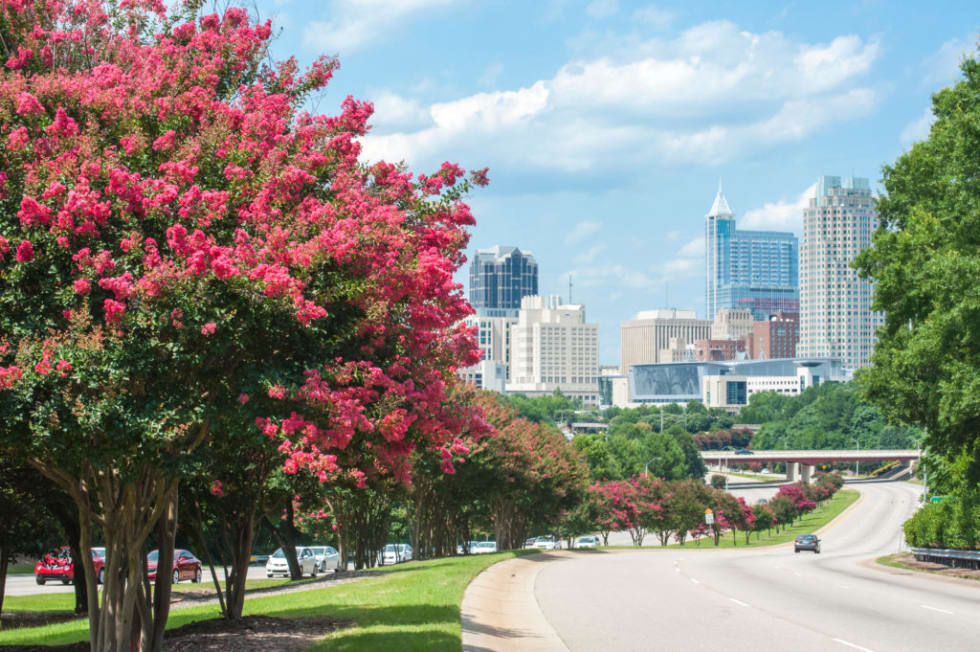
Coming in at #8 is Raleigh, NC. Of the top 10 metros on our list, Raleigh has the lowest average wages for recent college graduates. So, how did it secure the #8 spot? Like many of the top metros, Raleigh is rich with remote work opportunities for recent grads, a factor that has taken on far greater significance in light of the coronavirus pandemic. You’ll likely find many college graduates from Duke, NC State and UNC-Chapel Hill starting their careers in the Research Triangle.
If you’re single and moving to the Raleigh area, you’re in luck! The metro ranked 3rd on our recent best metros for dating study. It’s a hotbed for college students and young professionals, which will have you feeling right at home.

7. Minneapolis, MN

- The total population in Minneapolis, MN: 429,606
- Percentage of the population between 20 - 29 years old in Minneapolis, MN: 22%
- Average age: 32.2 years old
- Percentage of the population with a bachelor’s degree in Minneapolis, MN: 50.4%
- Median earnings for bachelor degree holders in Minneapolis, MN: $61,052
- Top industries in Minneapolis, MN: Healthcare, Government, Manufacturing, Retail Trade
- Average commute time to work in Minneapolis, MN: 22.9 minutes
- Average one-bedroom apartment rent in Minneapolis, MN: $1,061/month
- Cost of living in Minneapolis, MN: 5% higher than the national average
Minneapolis, MN ranks #7 on our list, with balanced economic performance across the board. The Twin Cities region boasts above-average scores in five of the six economic factors included in our ranking. The only one that trails is the percentage of recent college grads in work-from-home-friendly occupations, which speaks to the region’s large blue-collar industries that cannot easily transition to remote work. Thankfully, these industries are largely “essential” during quarantine, helping keep the unemployment relatively low and contributing to an economically-diverse population.
Similar to its Midwestern neighbor Indianapolis, Minneapolis is extremely affordable for recent college grads. Of the 50 metros surveyed, Minneapolis has the 4th lowest share of cost-burdened recent graduates. With all the money you are saving on rent, why not join your new neighbors rooting for one of Minneapolis’ four professional sports teams or simply enjoy a “Juicy Lucy” at a local pub?
Learn more about things you should know before moving to Minneapolis!
6. Austin, TX

- The total population in Austin, TX: 978,908
- Percentage of the population between 20 - 29 years old in Austin, TX: 19%
- Average age: 33.9 years old
- Percentage of the population with a bachelor’s degree in Austin, TX: 51.7%
- Median earnings for bachelor degree holders in Austin, TX: $58,921
- Top industries in Austin, TX: Technology, Pharmaceutical, Biotechnology
- Average commute time to work in Austin, TX: 24.1 minutes
- Average one-bedroom apartment rent in Austin, TX: $1,224/month
- Cost of living in Austin, TX: 3% lower than the national average
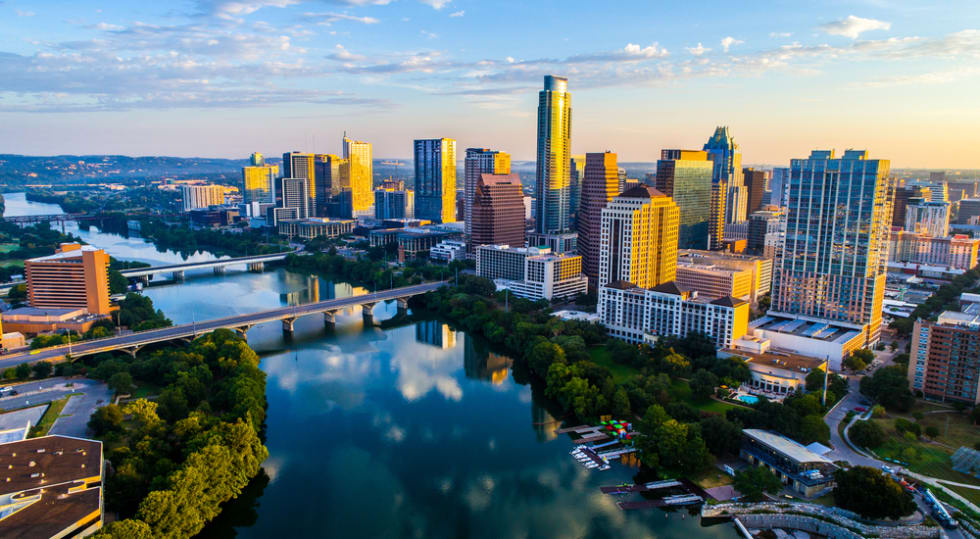
As one of the hottest metropolitan areas for young adults, it’s unsurprising that Austin, TX earned the #6 spot on our list. Despite the pandemic, Austin has still been attracting more and more renters from all parts of the country. According to Apartment List’s latest renter migration report, 70.9 percent of searches for apartments in Austin are coming from outside the metro, the highest share among the nation’s 50 largest metros. If you are planning a move to the area, you’ll have no problem finding other transplants to explore the city with.
Austin’s economic scores are well-rounded across the board, but the metro particularly stands out when it comes to the high density of college-educated adults (43 percent) and high share of recent college graduates working in remote-friendly occupations (77 percent). As we wait out the coronavirus pandemic, college graduates can find a remote job for an Austin-based company, and make the move when things start to clear up. After months in quarantine, nothing beats brisket from Franklin Barbecue and a dip in Barton Springs pool!
Learn more about things you should know before moving to Austin!
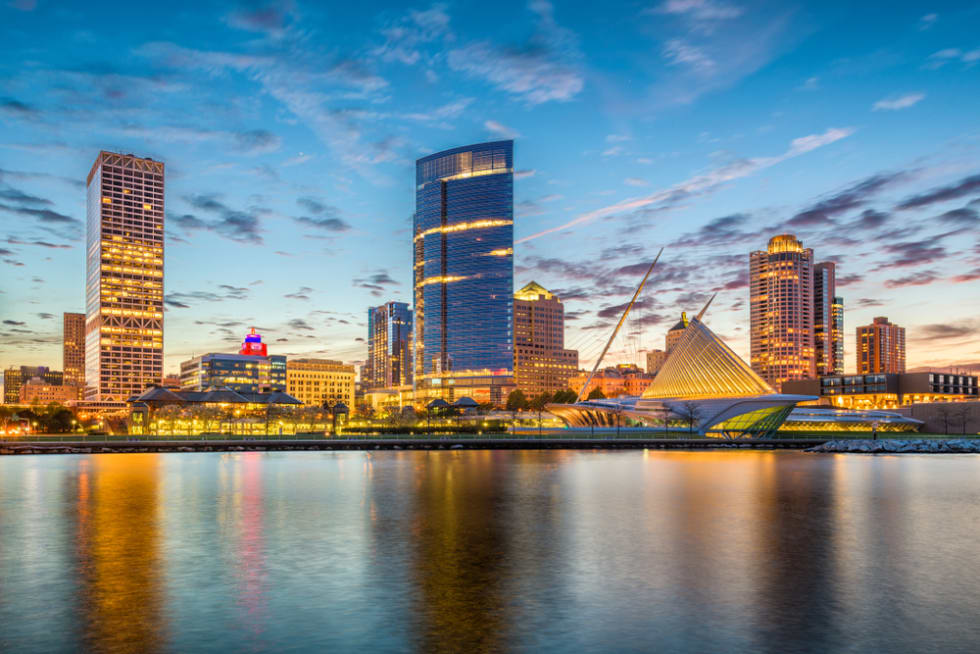
5. Milwaukee, WI

- The total population in Milwaukee, WI: 590,157
- Percentage of the population between 20 - 29 years old in Milwaukee, WI: 18%
- Average age: 31.5 years old
- Percentage of the population with a bachelor’s degree in Milwaukee, WI: 24.6%
- Median earnings for bachelor degree holders in Milwaukee, WI: $58,825
- Top industries in Milwaukee, WI: Manufacturing, Agriculture, Healthcare, Tourism
- Average commute time to work in Milwaukee, WI: 22.4 minutes
- Average one-bedroom apartment rent in Milwaukee, WI: $753/month
- Cost of living in Milwaukee, WI: 3% lower than the national average
Snagging the number 5 spot on our list is Milwaukee, WI! The only mid-sized metro to land in the top 10, Milwaukee’s economy has displayed strong signs of resilience throughout the pandemic. Despite below-average wages for recent college grads, its unemployment rate in March was below average at 3.3 percent and the area also boasts a relatively low cost of living. This results in the nation’s second-lowest cost-burden rate for young renters (25%). The local economy is also well suited to handle quarantine; only 8 percent of Milwaukee’s workforce is “high-risk,” the second lowest rate across the entire country.
These days, you can’t beat a promising job market, but what’s “normal” life like in Milwaukee? According to our annual renter survey, renters love the recreational activities and social life in the city, with both categories receiving an A-. The city is also a haven for beer lovers. Not only is the city home to Miller and Pabst beers, but you’ll also find an endless selection of craft breweries. Cheers!
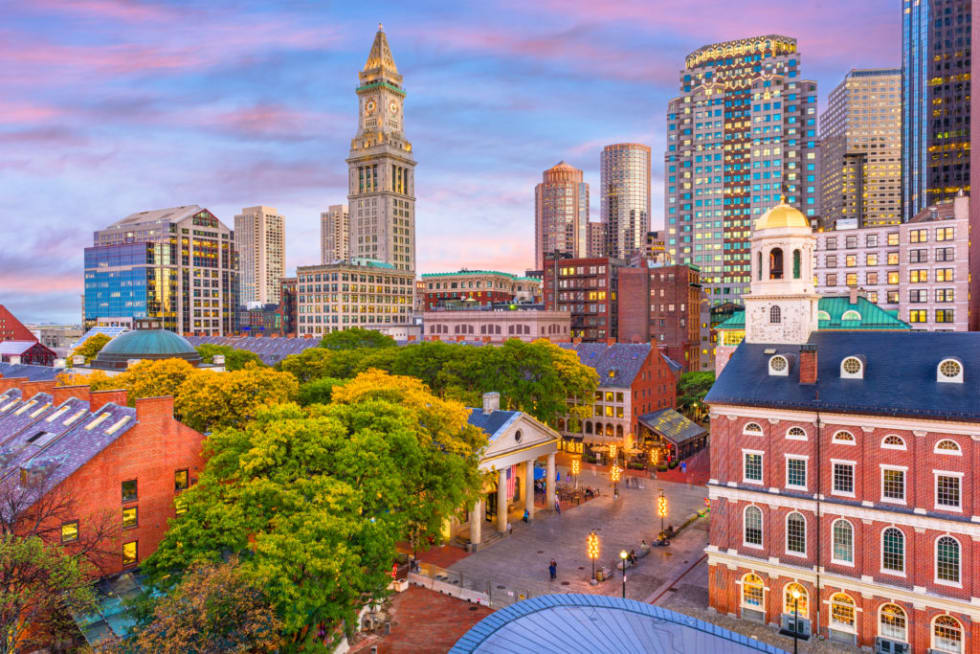
4. Boston, MA

- The total population in Boston, MA: 692,600
- Percentage of the population between 20 - 29 years old in Boston, MA: 24%
- Average age: 32.6 years old
- Percentage of the population with a bachelor’s degree in Boston, MA: 49.7%
- Median earnings for bachelor degree holders in Boston, MA: $65,565
- Top industries in Boston, MA: Education, Biotechnology, Tourism, Financial Services
- Average commute time to work in Boston, MA: 30.4 minutes
- Average one-bedroom apartment rent in Boston, MA: $1,684/month
- Cost of living in Boston, MA: 48% higher than the national average
Heading back to the east coast, Boston, MA is the 4th best metro for college grads. Similar to Milwaukee, Boston lands high in our rankings due its economic resilience throughout the pandemic. Of the 50 regions analyzed, Greater Boston maintained the 3rd lowest unemployment rate in March and is extremely well-educated. Known for having many local colleges and universities, nearly half of all adults in the area have a college degree.
Although Boston is no Silicon Valley (more on that later), it is a well-established technology hub. In fact, software developer is now the most common occupation among recent college graduates in Boston. The thriving biotech scene also makes it a top destination for grads with natural science degrees.
Another great reason to call Boston home? Beyond a passionate and polarizing sports fan base and its beautiful cobblestone streets, the metro receives glowing reviews from our renters. In our Boston renter survey, the city received an overall grade of A, and scored A+’s in both recreational activities and social life.

3. Washington, DC (DMV)

- The total population in Washington, DC: 705,749
- Percentage of the population between 20 - 29 years old in Washington, DC: 19%
- Average age: 34.3 years old
- Percentage of the population with a bachelor’s degree in Washington, DC: 58.5%
- Median earnings for bachelor degree holders in Washington, DC: $60,340
- Top industries in Washington, DC: Federal Government, Professional Services, Hospitality and Tourism, Healthcare/Life Sciences
- Average commute time to work in Washington, DC: 30 minutes
- Average one-bedroom apartment rent in Washington, DC: $1,586/month
- Cost of living in Washington, DC: 39% higher than the national average
Taking bronze in our best metros for college grads rankings is Washington, DC! DC metro, commonly referred to as the “DMV,” not only has a number of esteemed universities, but a solid job market that entices many post-graduates to stay in the area.
The best part? Not only do recent grads in DC make good wages (over $51,000 on average, ranking fifth in the nation), those wages will take you further than your peers living in other east coast “hot spots.” We found the cost burden rate among Washington DC’s recent college graduates (32 percent) is lower than New York (34 percent) and Boston (35 percent).
Once coronavirus passes, the DMV is also a lovely place to enjoy your 20-something years. Teeming with a rich history, lush parks and a diverse food scene, young professionals won’t grow tired of life in DC. Not to mention, the opportunity to (hopefully) cheer on the reigning world series champions. Go Nats!
Learn more about things you should know before moving to Washington, DC!

2. San Francisco, CA

- The total population in San Francisco, CA: 881,549
- Percentage of the population between 20 - 29 years old in San Francisco, CA: 17%
- Average age: 38.2 years old
- Percentage of the population with a bachelor’s degree in San Francisco, CA: 58.1%
- Median earnings for bachelor degree holders in San Francisco, CA: $69,803
- Top industries in San Francisco, CA: IT/Sofware, Social and Digital Media, Life Sciences and Biotechnology
- Average commute time to work in San Francisco, CA: 32.9 minutes
- Average one-bedroom apartment rent in San Francisco, CA: $2,082/month
- Cost of living in San Francisco, CA: 80% higher than the national average
Securing our #2 spot is the City By the Bay – San Francisco, CA! With high wages for recent college graduates (nearly $68,000 on average) and a high percentage of recent grads working in remote-friendly occupations (80 percent), it’s easy to see why San Francisco is a great place for recent college grads to start their careers, even in the face of the quarantine.
San Francisco is notorious for its cost of living, but since wages are high and young professionals tend to live with roommates, the local cost burden rate among recent college grads is actually ninth-lowest in the nation (27 percent), and is comparable to much more affordable metros like Jacksonville, Kansas City, and Detroit.
It’s important to keep in mind that for the graduating class of 2020, social life takes the backseat to economic vitality. And while San Francisco falls just short of the top spot in our economic rankings, you’ll also want to consider life post-Coronavirus. Young college graduates typically flock to San Francisco for its rich culture, temperate climate, and natural beauty. Just be prepared to rent with a roommate (or four).
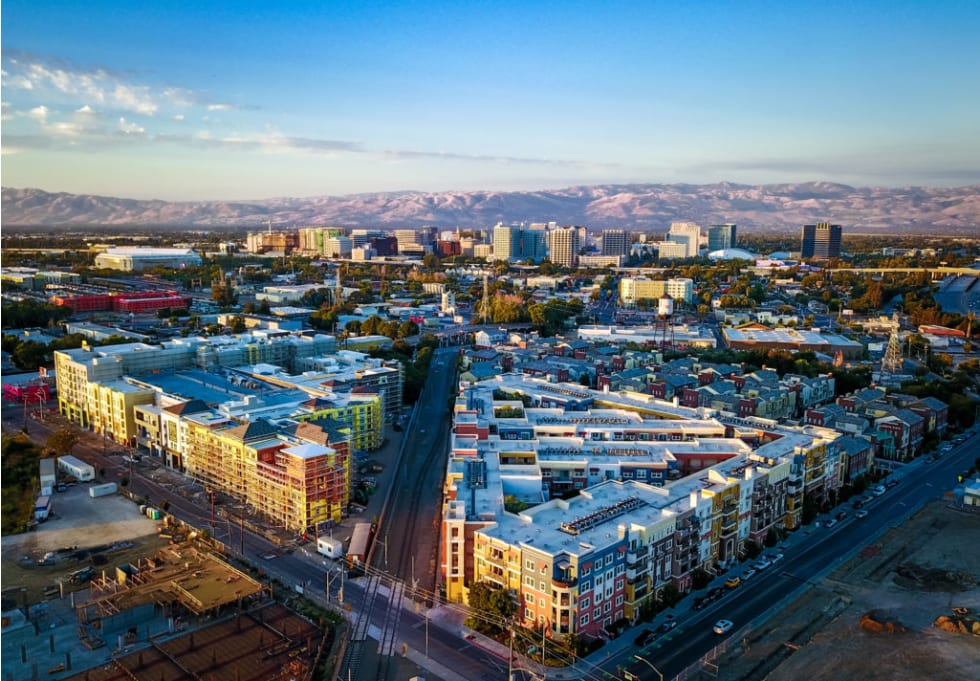
1. San Jose, CA

- The total population in San Jose, CA: 1,021,795
- Percentage of the population between 20 - 29 years old in San Jose, CA: 14%
- Average age: 37.4 years old
- Percentage of the population with a bachelor’s degree in San Jose, CA: 43.7%
- Median earnings for bachelor degree holders in San Jose, CA: $59,626
- Top industries in San Jose, CA: Manufacturing, Professional Services, Healthcare, Retail
- Average commute time to work in San Jose, CA: 29.4 minutes
- Average one-bedroom apartment rent in San Jose, CA: $1,745/month
- Cost of living in San Jose, CA: 49% higher than the national average
And the number one spot goes to…. drumroll tech powerhouse, San Jose, CA! Located in the heart of Silicon Valley, it shouldn’t come as a surprise that San Jose takes our number one spot; it ranks first on four of the six economic factors in our index). San Jose boasts the highest average wages for recent college graduates ($71,742), the highest percentage of working in remote-friendly occupations (84 percent), the lowest share working in “high-risk” industries (8 percent) as well as the highest concentration of college-educated adults (52%). Taken together, we expect San Jose will be able to bounce back from the coronavirus recession quicker than most.
The only blemish is San Jose’s relatively high cost-burden rate (34 percent), which ranks 30th out of 50. But for those who can secure affordable housing, the region offers not only a strong job market, but pristine weather year-round and a more relaxed pace of life compared to its neighbor to the north, San Francisco.
Learn more about things you should know before moving to California!
Best Metros for College Graduates Data
| Metro | Rank | Score |
|---|---|---|
| Atlanta, GA | 16 | 0.26 |
| Austin, TX | 6 | 0.62 |
| Baltimore, MD | 11 | 0.52 |
| Birmingham, AL | 39 | -0.47 |
| Boston, MA | 4 | 0.98 |
| Buffalo, NY | 32 | -0.25 |
| Charlotte, NC | 19 | 0.21 |
| Chicago, IL | 23 | 0.07 |
| Cincinnati, OH | 18 | 0.23 |
| Cleveland, OH | 44 | -0.72 |
Download Complete Local Data
- Check out the full local data for these social and lifestyle factors. Despite not being included in this year’s index, they help provide a more well-rounded picture of what life is like in each region.↩
- Our index is calculated for the nation’s 50 largest metropolitan areas. Recent college graduates are anyone under the age of 30 with at least a 4-year bachelor’s degree. For each factor in the index, we calculate each metro’s z-score, equal to the number of standard deviations above or below the mean value for that factor. A positive z-score means the region performs better with regard to that factor. A metro’s final index score is the mean of its six factor z-scores.↩
- Source: US Census Bureau, American Community Survey, 2018. Accessed via IPUMS-USA↩
- At the time of publication, March 2020 is the most recent month with market-level unemployment statistics available. Unemployment surged to even higher levels throughout the month of April. Source: Bureau of Labor Statistics, Local Area Unemployment Statistics, March 2020.↩
- Cost burdened renters are those living in households that spend more than 30 percent of their income on rent. Source: US Census Bureau, American Community Survey, 2018. Accessed via IPUMS-USA.↩
- Source: US Census Bureau, American Community Survey, 2018. Accessed via IPUMS-USA.↩
- Occupations amenable to remote work are those in which more than 15 percent of full-time workers (nationally) say they have the opportunity to work from home. See this report for details. Sources: Apartment List calculations using US Census Bureau American Community Survey (2018) and Bureau of Labor Statistics American Time Use Survey and Leave Module (2017-2018).↩
- High risk refers to occupations that are not amenable to remote work and that are not considered “essential” by most shelter-in-place guidelines. See this report for details. Sources: Apartment List calculations using US Census Bureau American Community Survey (2018) and Bureau of Labor Statistics American Time Use Survey and Leave Module (2017-2018).↩
Share this Article


