Where Are Rents Growing the Fastest?
When searching for a new place to call home, it’s important to know what’s happening with rent prices in your city. As peak renting season begins, we analyzed rent growth rates from 2015 to 2018 to see which cities have seen the biggest changes.
Download Complete City-Level Data
Rent growth slowing nationally
Our estimates show that annual rent growth rates at the national level have been trending downward for the past few years. Note, however, that although rent growth has slowed, it remains in positive territory. Rents are still increasing, just at a slower pace.
From June 2014 through June 2015, the national median rent increased at a fairly rapid pace of 3.6 percent. However, rent growth slowed in each of the three subsequent years, and national year-over-year rent growth currently stands at a modest rate of 1.5 percent, less than half the rate from 2015. This national trend is mirrored in many of the nation's largest cities, although some areas have seen growth rates increase. Use the drop-down menu in the chart below to view year-over-year rent growth rates for your city:
This slowdown in rent growth is partially attributable to an increasing supply of new rental inventory in many markets. While new single-family home construction continues to lag, spending on construction of new multi-family housing -- most of which are rental properties -- is close to its pre-recession peak. At the same time, despite a lack of for-sale inventory, the homeownership rate has begun to increase for the first time since the collapse of the housing bubble, leading to a decline in the number of renter households.
These factors have started to create softness in the rental market, preventing landlords from increasing rents as much as in prior years. This year’s modest growth rate of 1.5 percent is lagging both wage growth (2.7 percent) and overall inflation (2.5 percent). This is a welcome sign of relief for renters, many of whom are still struggling with affordability.
Biggest Movers: New inventory halts rent growth in Seattle, while Hurricane Harvey leads to a sharp increase in Houston
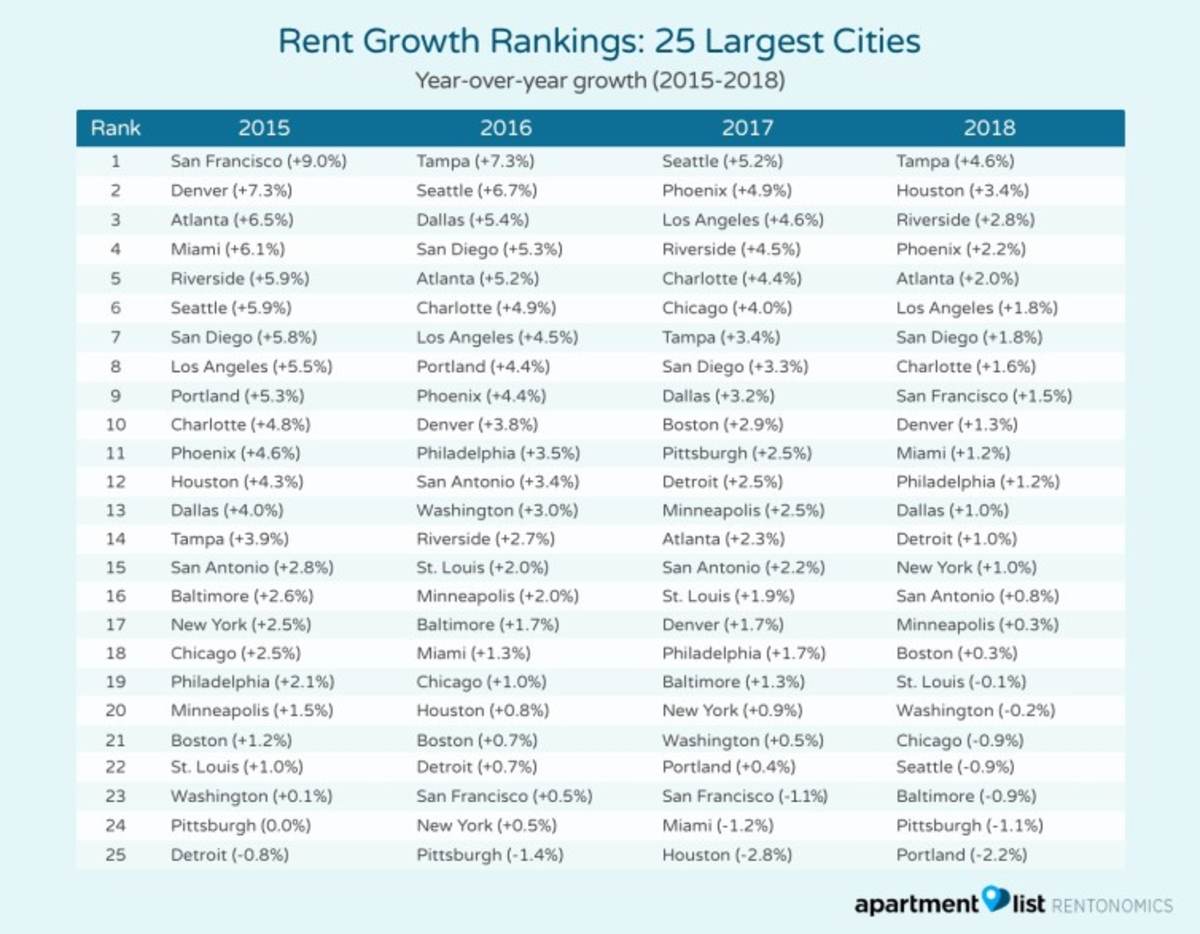
While our national index provides a valuable overview of high-level trends, there is significant variation across cities. This can be seen in the following table, which ranks the nation’s 25 largest cities from fastest to slowest rent growth for each of the past four years:
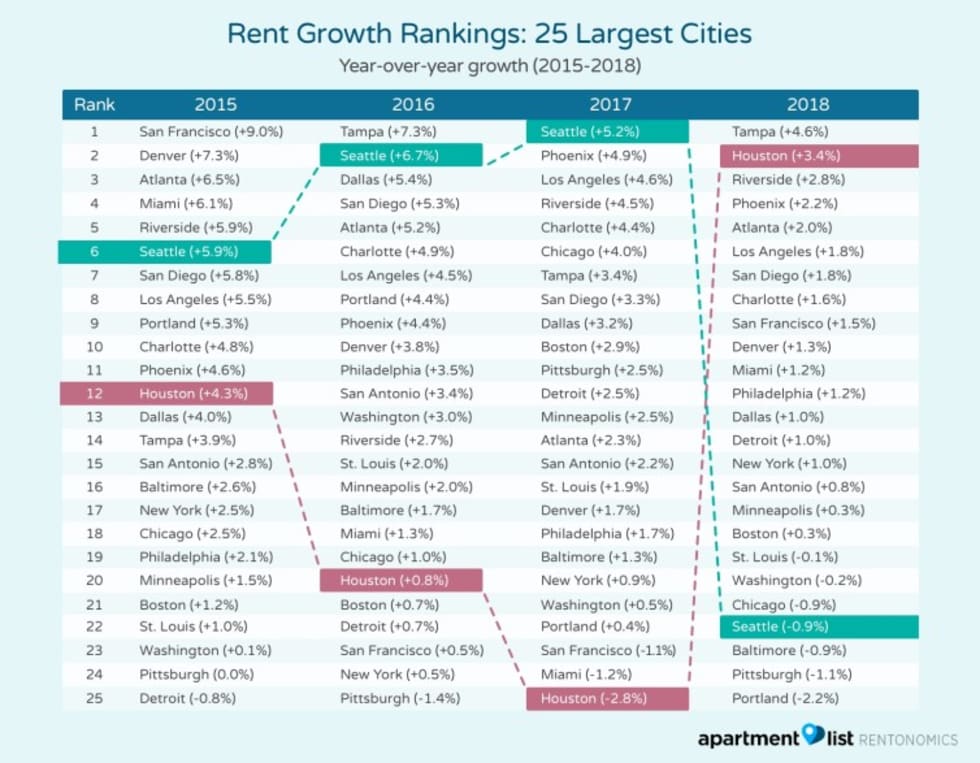
City rankings change substantially from year to year. From 2017 to 2018, Seattle experienced the largest drop in the rankings, after experiencing rent growth above 5 percent for each year from 2015 to 2017. In fact, in 2017, Seattle had the fastest rent growth of the nation’s 25 largest cities at 5.2 percent. In the year ending June 1, 2018, however, Seattle saw its rank fall to #22, with rents decreasing by 0.9 percent. Seattle has seen a record number of new units hit the market over the past couple of years, and it seems that all this new supply has now put a halt to the city’s rent growth. Interestingly, while Seattle’s rent growth has dropped off, the city’s for-sale inventory is still tightly constrained, and the city’s home prices are the fastest-growing in the nation. Similar slowdowns can be seen in Portland and Denver, both of which have also added substantial amounts of new rental housing.
At the other end of the spectrum, Houston ranked last in our rent growth rankings last year, with a 2.8 percent decline in prices, but the city now ranks #2 of the 25 largest cities, with a 3.4 increase over the past year. Houston presents a unique example. The devastation of Hurricane Harvey destroyed a substantial number of homes in the city last August. Before Harvey, Houston had one of the nation’s highest vacancy rates, but now suffers from a shortage of available rental units. Although many landlords froze rents in the immediate aftermath of Harvey, our data show a sharp spike in rents in Houston through the winter months, a time when rent prices normally fall. More recently prices seem to have stabilized.
Download Complete City-Level Data
We release rent reports for hundreds of cities across the nation on the first business day of each month. Details on the methodology behind our estimates can be found here. For any questions, feel free to reach out to us at rentonomics@apartmentlist.com.
Share this Article
