Super Commuting Patterns at the County Level

Download County-Level Data
Earlier this year, we released a report digging into the changing nature of American commute times, noting a sharp rise in the share of workers who bear through commute times of 90 minutes or more each way. The number of “super commuters” grew by 32 percent from 2005 to 2017, more than triple the 9 percent growth rate for workers with commutes shorter than 90 minutes. Our original analysis explored this trend for the nation’s 100 largest metros, but today we’re drilling down a level deeper with a detailed map showing the share of the workforce that super commutes for every county in the country.
While this new view confirms patterns identified in our original report, it also unearths new ones. Beyond the super commuters who drive from distant exurbs to work in the downtown offices of pricey superstar cities, we also see high rates of super commuting in some counties that are much closer to the urban core. This is evidence of the large number of super commuters who rely on public transit. Super commuting is also common in certain pockets of rural America, particularly those with active drilling and mining industries.
Super commuting by public transit
As we’ve noted before, super commuters are highly concentrated on the peripheries of the nation’s supply-constrained coastal hubs, with the San Francisco and New York City regions serving as prime examples. As technology, finance, and other industries continue to cluster in these job markets, a lack of new housing supply has driven up prices. As a result, workers are pushed further and further from the urban core in the search for more affordable housing options.
In San Joaquin County, 8.8 percent of workers identify as super commuters, compared to the national average of 2.9 percent. The majority of these workers are likely traveling more than 75 miles to downtown San Francisco. Pike County, PA, which sits on the far outskirts of the New York City metro, has the nation’s highest super commuter share, with a staggering 17 percent of the workforce commuting 90 minutes or more each way.
However, in contrast to the two examples just mentioned, the county-level data for New York also shows that super commutes are not limited to those traveling great distances. Richmond County, NY -- better known as Staten Island -- sits a short distance from Manhattan but has the nation’s fifth highest super commuter share at 14.3 percent. These commuters are likely getting to work via time-consuming public transit options, in which a single trip might include traveling by bus, ferry, subway, and foot. While Staten Island is the furthest removed from Manhattan, we observe elevated levels of super commuting in each of New York City’s outer boroughs

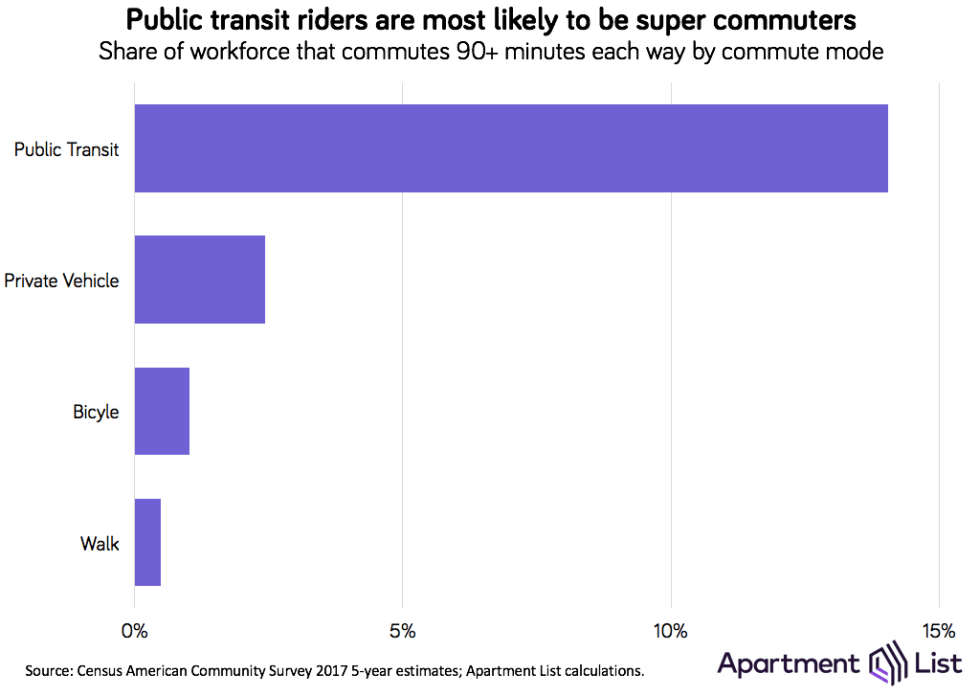
In fact, we find that workers who rely on public transit are most likely to be super commuters, by a wide margin. Among those who get to work by public transit, 14.0 percent are super commuters, compared to just 2.4 percent of those who travel to work by car. Transit use is also disproportionately common among those at the low end of the income distribution, indicating that relying on public transit is more often a matter of necessity than of choice. That said, living car-free is one of the single most effective ways for an individual to reduce their carbon footprint. The high rate of super commuting among transit users speaks to the need for investment in robust transit options in order to grow our cities in inclusive and sustainable ways.
Super commuting in rural America
While our original analysis focussed on the nation’s large metro areas, this county level map also unearths interesting trends in less populous parts of the country. Note, for example, the darkly shaded strip of counties stretching from East Texas to Mississippi. Some of these counties lie within super commuting distance of New Orleans and Houston, and may represent the relocation of workers displaced from those cities in the wake of major natural disasters. However, this region is also a hot spot for oil drilling along the Gulf Coast. While workers at onshore drilling sites may bear lengthy daily commutes, those working on offshore rigs generally spend weeks at a time living on the job site, adding a new meaning to the definition of a super commute.
Similar trends are visible in other parts of the country as well. Where the borders of West Virginia, Kentucky, and Ohio converge, we observe a dark patch that coincides with the nation’s foremost coal mining region. With that industry on a long-term decline, the remaining coal workers are faced with longer commutes to the reach the dwindling number of active mines. Notably, the counties in this region also have some of the nation’s highest rates of drug overdose deaths. While super commuting is often thought of as a symptom of a region’s rapid economic growth, we see here that it can also be indicative of a struggling local economy in which workers must travel long distances to access scarce job opportunities.

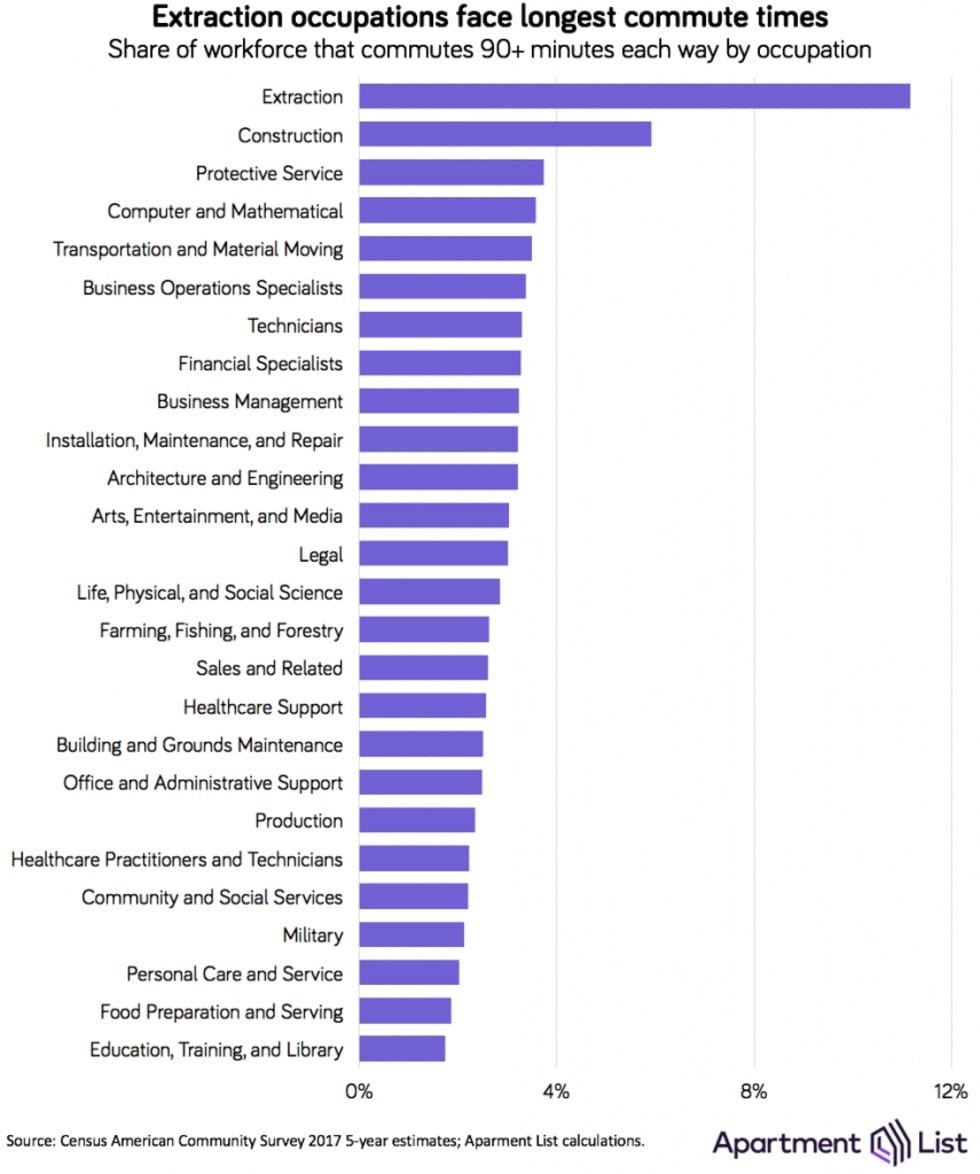
11.2 percent of workers in the extraction occupations -- which encompass oil drilling and mining -- are super commuters. This is the highest rate among all occupation categories, followed by construction occupations at 5.9 percent. Many rural counties with high rates of super commuting also have a high share of workers in these occupations. In Elko County, NV -- which ranks number 11 out more than 3000 counties in the U.S. for super commuting -- 10.5 percent of workers fall under the “natural resources and mining” occupation code, compared to just 1.3 percent nationally. We also see counties with high super commuter rates in the area surrounding the Bakken oil fields of North Dakota. While jobs in these industries can involve dangerous working conditions and a lack of job security, they can also be highly lucrative positions that entice workers to travel significant distances to get to the job.
Conclusion
While the prospect of a three hour daily commute may seem like a burden that few would be willing to bear, we find that such arrangements have grown increasingly commonplace in recent years. This trend is often attributed to workers in superstar cities being priced out to far flung exurbs, a pattern that can certainly be observed in the map above. However, we also find that super commuting is common in areas closer to the urban core, where workers who rely on public transit may face rides of 90 minutes or more, even if they’re not traveling great distances in terms of mileage. Super commuting hot spots also show up in pockets of rural America, where blue collar workers in select occupations commute far distances to remote job sites. Explore the map above to unearth super commuting patterns in your area and around the country.
Download County-Level Data
Share this Article
