Apartment List Renter Migration Report: 2024
Welcome to the 2024 Apartment List Renter Migration Report. Here we analyze data on millions of searches to see where our users are looking to move, shedding new light on the migration patterns of America’s renters. This report incorporates the search preferences of users who registered with Apartment List between January 1 and December 31, 2023.1
Migration patterns settling down from pandemic-era shakeups
In recent years, changing preferences due to the pandemic and the increased adoption of remote work have driven rapid shifts in America’s migration patterns. Most notably, there have been outflows from some of the nation’s largest and most expensive markets and influxes to some more affordable and less densely populated parts of the country. But the most recent data show that even as many of the key migration patterns of recent years continue, things are beginning to settle down. In 2023, more renters were looking to stay put in the region where they currently live and fewer were looking to make long-distance moves.

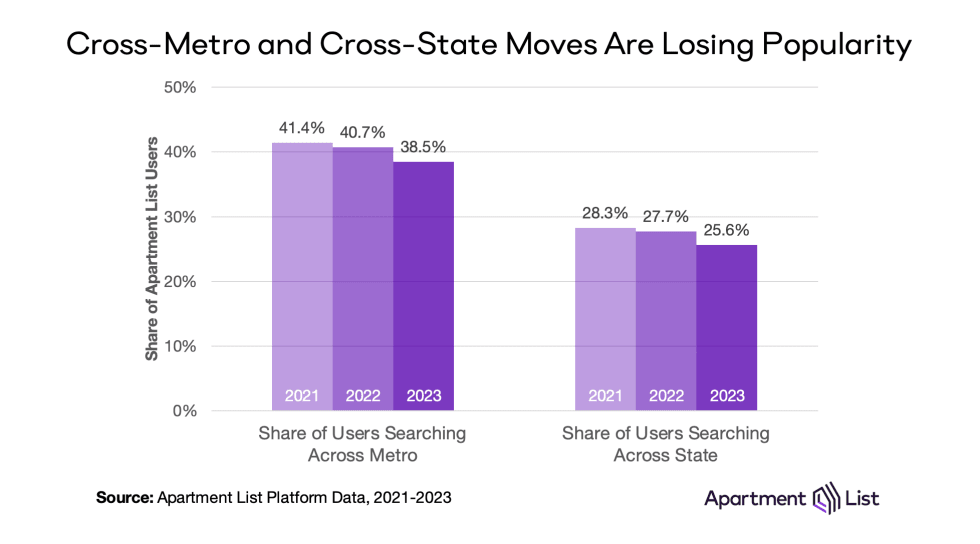
The share of users on our platform looking to move to a new metro or state has now dipped for a second straight year, and the decline in 2023 was more substantial than that of 2022. In 2023, 38.5 percent of Apartment list users were looking to move to a new metro, down from 40.7 percent in 2022; the share looking to move to a new state fell from 27.7 percent to 25.6 percent.
A slowdown in cross-state migration is also evident in the latest official state-level population estimates recently released by the Census Bureau. Those estimates show that the states that lost population due to domestic migration in 2023 lost less than they did in 2022, while the states that gained population gained less. But even as domestic migration has slowed, the flows show a clear continuation of trends that we’ve seen in recent years.
Americans are continuing to leave West Coast and Northeast states for the Sunbelt and Mountain West
Census data shows that from 2022 to 2023, states along the West Coast and throughout the Northeast continued to lose population to states in the Sun Belt and Mountain West regions. These migration flows were smaller in magnitude compared to the year prior, but a number of states still saw significant losses or gains.
California and New York continue to be the two states with the largest domestic migration outflows, not just in absolute terms but also as a percentage of their overall populations. California lost 338 thousand residents to other states, equating to 0.9 percent of the state’s total population, while New York lost 278 thousand residents, or 1.1 percent of its population.2 Illinois also ranks among the top five for domestic out-migration in both absolute and percentage terms. The top five for absolute out-migration is rounded out by New Jersey and Massachusetts, while Hawaii and Alaska round out the top five in percentage terms.
At the other end of the spectrum, Florida and Texas have gained the most population from domestic migration in absolute terms, with inflows of 194 thousand and 187 thousand, respectively. North Carolina, South Carolina, and Tennessee round out the top 5, demonstrating the degree to which Southern states have been rapidly pulling in Americans from other parts of the country. South Carolina, North Carolina, Tennessee and Florida also all rank among the top 5 for percentage population growth due to domestic migration. Texas, however, drops to #9 when ranked in percentage terms, trailing not just the already mentioned states, but also Delaware, Montana, Idaho, and Maine. This percentage view highlights how some of the nation’s less populous states – particularly in the Mountain West region – are growing quite rapidly in relative terms.
CA and NY continuing to export renters to TX and FL
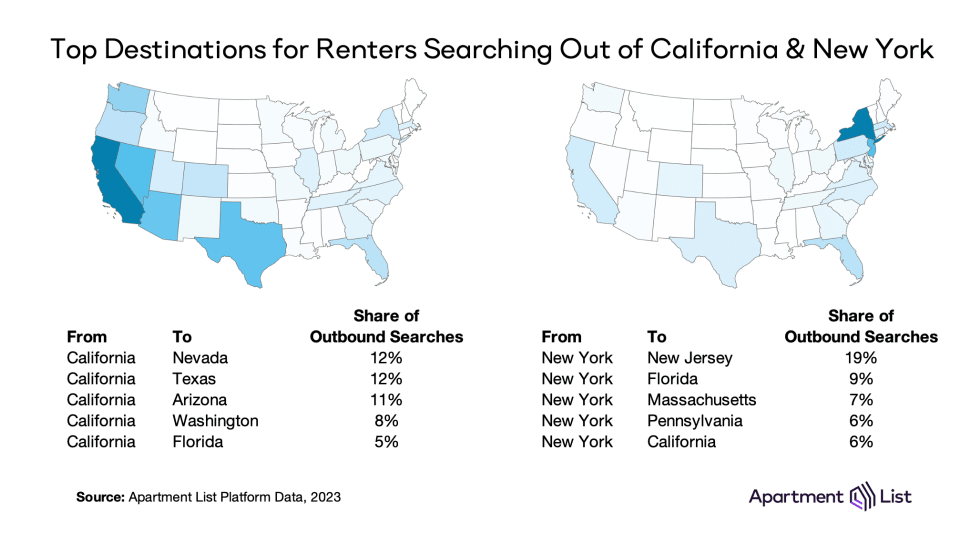
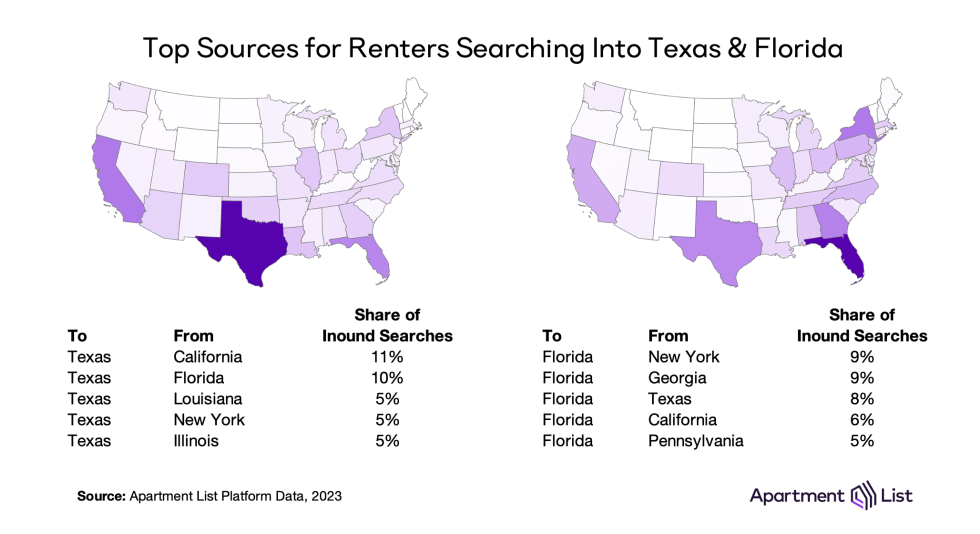
The currently published data from Census does not offer details on specific channels of migration (e.g. where did those who left California in 2023 move to), but our Apartment List search data can help fill in that gap. Here we dig into the top destinations for renters looking to leave the two states that lost the most population due to domestic migration according to Census (California and New York), as well as the sources of renters flowing into the two fastest growing states (Florida and Texas).

For renters looking to move away from California, neighboring Nevada is the most common destination, but Texas and Florida both land in the top 5. With the exception of Washington, the top 5 destinations for Californians represent a flight to more affordable Sun Belt states. This flight to affordability is less clearly evident in the outbound search destinations for New Yorkers, many of whom are looking to move to other expensive states including New Jersey, Massachusetts, and California. That said, Florida still ranks as the #2 search destination for outbound New Yorkers, and Texas falls just outside the top 5 at #6.

When we look at the most common sources of renters looking to move to Florida and Texas from out-of-state, California and New York both rank among the top 5 for both states. New York is the #1 source of renters looking to move to Florida and California is the #1 source for Texas, validating a popular narrative of Americans fleeing the nation’s most expensive states and driving up prices in previously affordable ones. But we also see significant cross-flows between these two states – Texas is among the top 3 sources of inbound searches to Florida and vice versa. Our search data shows that there are nearly as many Floridians as Californians searching for apartments in Texas.
NC, SC, and FL account for 7 of the 10 metros attracting the most interest from out-of-towners
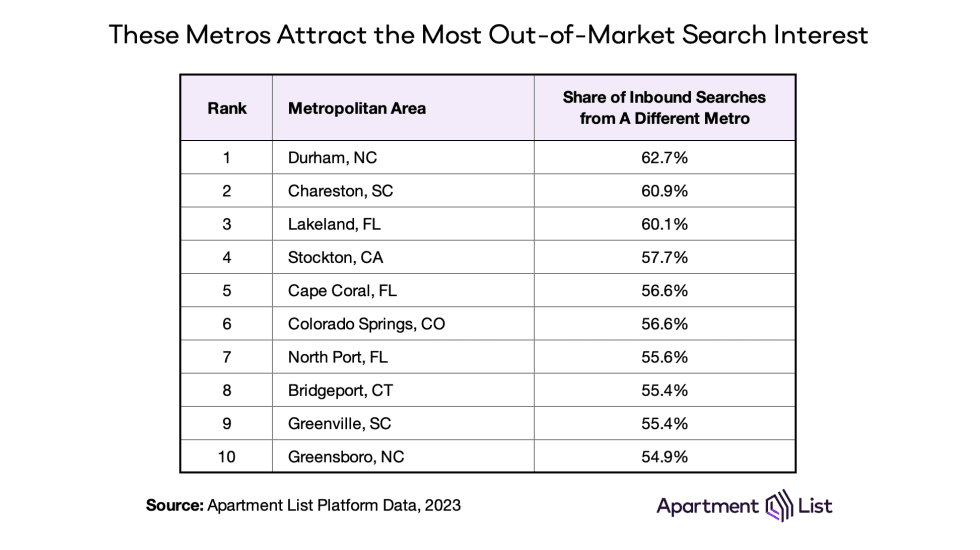
The metro-level cuts of our search data also validate trends seen in the Census data. The table below shows the 10 metros with the highest share of inbound searches coming from renters currently living in a different metro.

Durham, NC tops this list, with 63 percent of searches coming from out-of-towners, followed by Charleston, SC at 61 percent. For both of these metros, nearby Raleigh and Charlotte are the top sources of inbound searches, but the New York City metro is the third most common source for both. North Carolina, South Carolina, and Florida account for 7 of the top 10 metros with the most interest coming from out-of-towners, confirming the popularity of these states among Americans looking to make long-distance moves. Another trend represented on this list is renters priced out of the nation’s most expensive markets searching in more affordable neighboring markets – for example, from San Francisco to Stockton, CA, and from New York City to Bridgeport, CT.
Conclusion
The geographic flexibility offered by remote work has caused a significant shock to America’s migration patterns in recent years. At the same time, waning housing affordability has driven many Americans to seek out more affordable pastures. But today, as we near the four-year anniversary of the pandemic’s onset, many remote workers have been called back to the office (at least part-time), and the price advantage of many once affordable markets has been eroded by the skyrocketing prices of recent years. As a result, migration trends appear to be settling down. While the dominant migration patterns of recent years are still prevailing, their magnitude is shrinking.
- The analysis in this report is based on apartment searches rather than completed moves, based on the search preferences that users provide when they register for Apartment List.↩
- In this report, we analyze only the net domestic migration estimates released by Census, as this is the component of population change that aligns most closely with the Apartment List data that we present in tandem. Note that domestic migration is just one component of population change, which is also impacted by international migration and natural population change (births and deaths).↩
Share this Article

