Apartment List Renter Migration Report: 2025
Welcome to the 2025 Apartment List Renter Migration Report. Here we analyze data on millions of searches to see where our users are looking to move, shedding new light on the migration patterns of America’s renters. This report incorporates the search preferences of users who registered with Apartment List between January 1 and December 31, 2024.1
Migration patterns settling down from pandemic-era shakeups
Since the COVID-19 pandemic, developments in remote work, housing affordability, and local economic growth/decline have shifted American migration patterns. Most notably, there have been outflows from some of the nation's largest and most-expensive housing markets to more-affordable and less-densely populated ones. Overall migration has slowed somewhat, as have long-distance moves to a new state or a new metropolitan area. Search data from Apartment List captured this for several years, but the trends have stabilized in 2024.
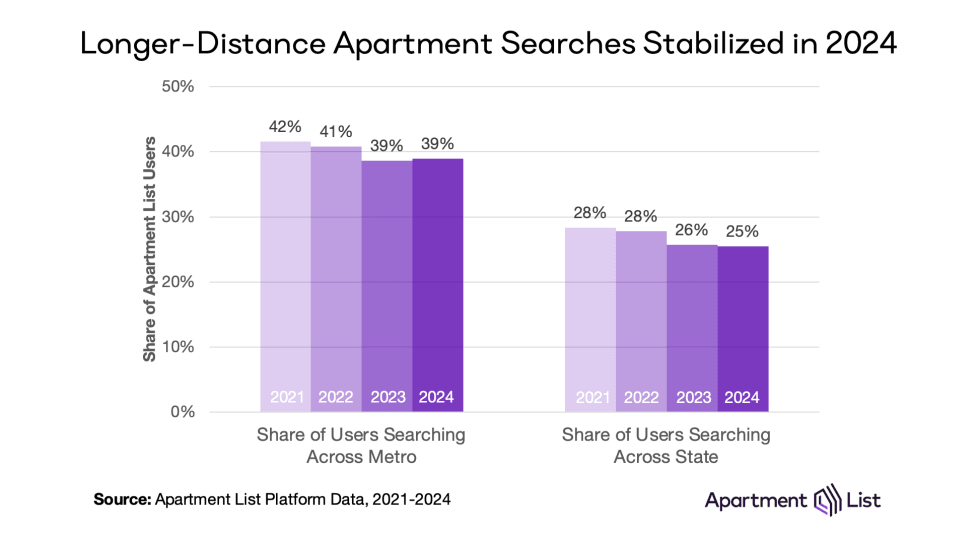
After trending down gradually since 2021, the share of renters on our platform looking to move to a new metro or a new state stabilized in 2024. Last year, 39 percent of Apartment List users were searching in a different metro, in line with 2023 but down a few percentage points from 2021. One-quarter were searching in a different state altogether, again down slightly from previous years.
Americans are continuing to migrate to the Sunbelt and Mountain West
Census data shows that from 2023 to 2024, states with some of the nation’s largest, densest, and most expensive population centers continued to lose population to states in the Sun Belt and Mountain West regions. This pattern has held true for several years, despite net domestic migration (i.e., population change driven by movers, rather than births/deaths) continuing to trend down.2
In absolute terms, California, New York, Illinois, New Jersey, and Massachusetts had the largest net domestic migration outflows between 2023 and 2024. In California specifically, 240,000 more people moved out of the state than moved into it. California’s total population did grow year-over-year (+233,000), but only because net negative domestic migration was offset by net positive international migration (+361,000) and net positive natural growth (110,000 more births than deaths). So the state continues to grow, while still being a major exporter of residents across the country. In percentage terms, the state that lost the highest share of residents to domestic migration is Hawaii (-0.6 percent).
At the other end of the spectrum, Texas, North and South Carolina, Florida, and Tennessee have gained the largest population from domestic migration. In Texas, net domestic migration totaled +85,000, and coupled with positive international migration (+320,000), and positive natural growth (+229,000), the state grew by more than one-half million people between 2023 and 2024. In percentage terms, South Carolina recorded the largest net domestic migration for the third consecutive year. Idaho came in second, as it sustains growth after an explosion in popularity early in the pandemic.
CA and NY continue to export renters to TX and FL
The currently published data from Census does not offer details on specific channels of migration (e.g. where did the movers out of California move to), but our Apartment List search data can help fill in that gap. Here we dig into the top destinations for renters looking to leave the two states that lost the largest populations due to domestic outmigration according to Census (California and New York), as well as the sources of renters searching into the two states that took in the most domestic movers (Texas and North Carolina).
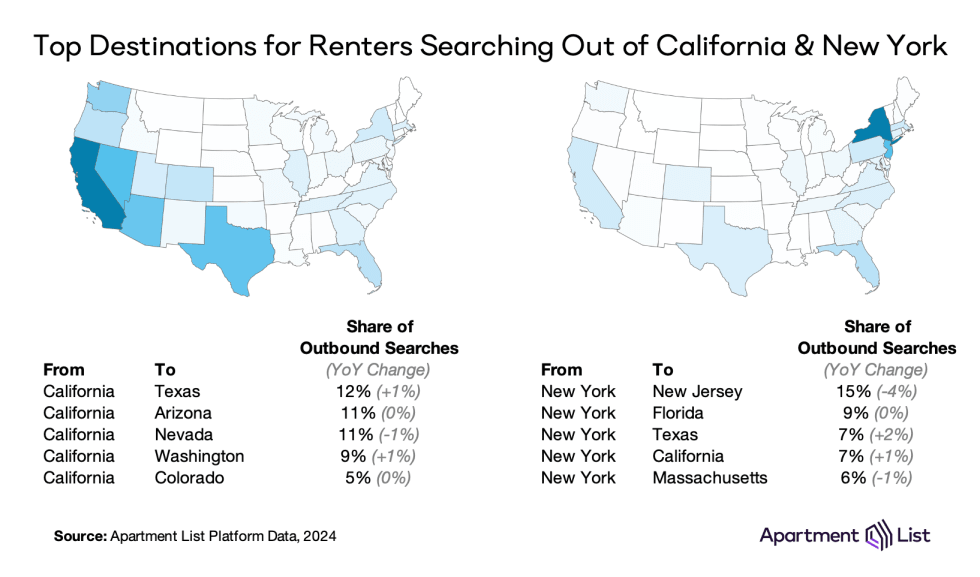
For renters looking to move away from California, Texas was the most popular destination, edging out neighboring Nevada and Arizona. Washington and Colorado rounded out the Top 5. Interestingly, Florida dropped out of the Top 5; the Sunshine State received 5.3 percent of California’s outbound searches in 2023 but that share dropped to 4.2 percent in 2024. This was offset by a slight year-over-year bump in popularity to Texas, from 11.0 percent to 12.4 percent. Texas also gained popularity among renters searching out of New York, receiving 7 percent of outbound searches and coming third behind New Jersey and Florida.
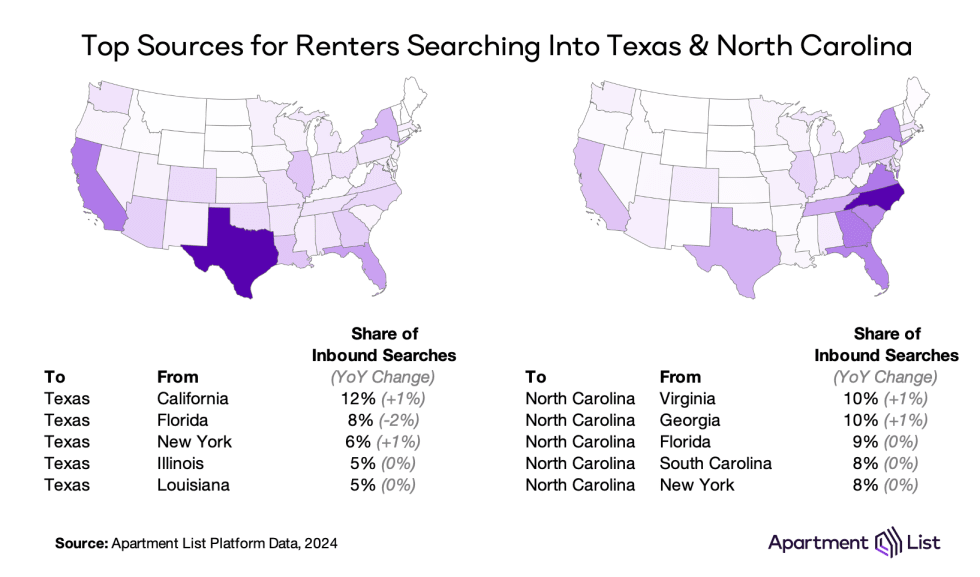
Texas and North Carolina gained more residents through domestic migration in 2024 than any other state. When we look at the most common sources of inbound rental searches, we see New York and Florida in both states’ Top 5. Texas receives a lot of interest from major metropolitan states like California, New York, and Illinois, while interest in North Carolina is more localized, coming from Atlantic neighbors Virginia, Georgia, Florida, and South Carolina.
The Carolinas account for 4 of the 10 metros attracting the most interest from out-of-towners
The metro-level cuts of our search data also validate trends seen in the Census data. The table below shows the 10 metros with the highest share of inbound searches coming from renters currently living in a different metro.
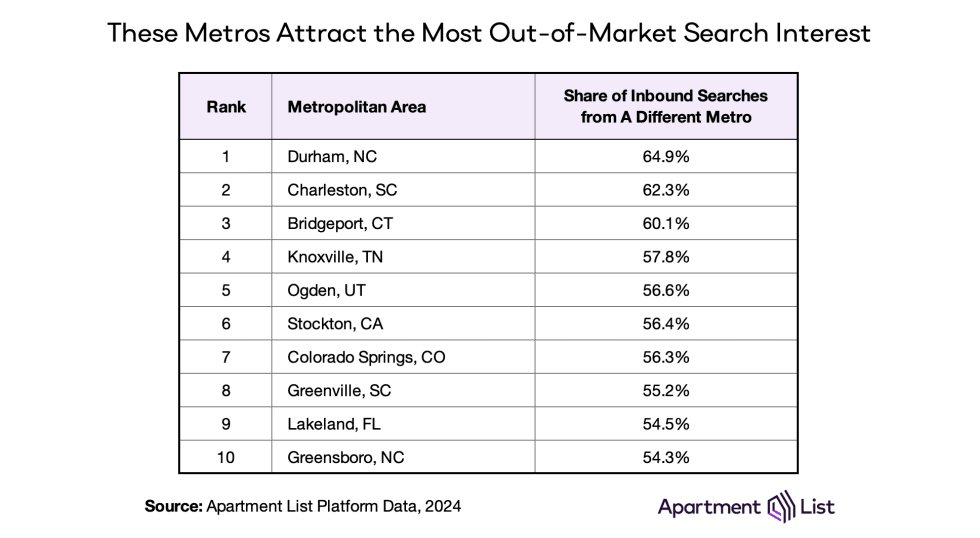
Durham, NC tops this list, with 65 percent of searches coming from out-of-towners, followed by Charleston, SC at 62 percent. For both of these metros, nearby Raleigh and Charlotte are the top sources of inbound searches, but Atlanta, New York City, and Washington DC metros provide substantial interest as well. North and South Carolina account for 4 of the top 10 metros with the most interest coming from out-of-towners, confirming the popularity of these states among Americans looking to make long-distance moves. Another trend represented on this list is renters priced out of the nation’s most expensive markets searching in more affordable neighboring markets – for example, from San Francisco to Stockton, CA, from New York City to Bridgeport, CT, and from Denver to Colorado Springs.
Conclusion
The geographic flexibility offered by remote work, coupled with worsening affordability, have swayed America’s migration patterns in recent years. Despite migration rates slowing, data from the Census Bureau as well as the Apartment List platform signal sustained interest in lower-density, lower-cost regions of the country, namely the Southeast and Mountain West. But as remote work appears to be losing some momentum, popularity in these regions may also wane, at least for markets that do not offer competitive wages. See below for full metro- and state-level data.
Complete metro- and state-level migration data
For access to granular data, the tables below offer summaries for over 100 metropolitan areas and all 50 states + DC.
Metro-Level Data
| Metro | Outbound Share (1) | Top Outbound Location (2) | Inbound Share (3) | Top Inbound Location (4) |
|---|---|---|---|---|
| Akron, OH | 44.1% | Cleveland, OH | 47.7% | Cleveland, OH |
| Albany, NY | 42.6% | Syracuse, NY | 37.4% | Syracuse, NY |
| Albuquerque, NM | 23.0% | Santa Fe, NM | 37.8% | Phoenix, AZ |
| Allentown, PA | 40.1% | Philadelphia, PA | 51.0% | Philadelphia, PA |
| Ann Arbor, MI | 50.8% | Detroit, MI | 53.2% | Detroit, MI |
| Atlanta, GA | 37.6% | Augusta, GA | 22.6% | New York, NY |
| Austin, TX | 47.2% | San Antonio, TX | 42.4% | Dallas, TX |
| Baltimore, MD | 51.8% | Washington, DC | 33.3% | Washington, DC |
| Baton Rouge, LA | 28.1% | New Orleans, LA | 48.5% | New Orleans, LA |
| Birmingham, AL | 51.5% | Huntsville, AL | 31.5% | Atlanta, GA |
Table notes:
- The share of searches from the metro (ie. outbound searches) that are destined for apartments outside the metro.
- Among outbound searches leaving the metro, the most popular destination.
- The share of searches into the metro (ie. inbound searches) that originated from users who lives outside the metro.
- Among inbound searches into the metro, the most popular source location.
State-Level Data
| State | Outbound Share (1) | Top Outbound Location (2) | Inbound Share (3) | Top Inbound Location (4) |
|---|---|---|---|---|
| Alabama | 36.7% | Louisiana | 24.5% | Georgia |
| Alaska | 35.1% | Washington | 48.8% | Washington |
| Arizona | 19.5% | California | 26.0% | California |
| Arkansas | 32.8% | Texas | 38.6% | Texas |
| California | 17.4% | Texas | 13.7% | Texas |
| Colorado | 23.1% | Texas | 30.7% | Texas |
| Connecticut | 29.8% | Massachusetts | 34.1% | New York |
| Delaware | 34.3% | Pennsylvania | 44.9% | Pennsylvania |
| District of Columbia | 57.1% | Maryland | 70.3% | Maryland |
| Florida | 17.6% | Texas | 21.0% | Georgia |
Table notes:
- The share of searches from the metro (ie. outbound searches) that are destined for apartments outside the metro.
- Among outbound searches leaving the metro, the most popular destination.
- The share of searches into the metro (ie. inbound searches) that originated from users who lives outside the metro.
- Among inbound searches into the metro, the most popular source location.
- The analysis in this report is based on apartment searches rather than completed moves, based on the search preferences that users provide when they register for Apartment List.↩
- In this report, we focus on net domestic migration as estimated by the Census Bureau, for it is the component of population change that aligns most closely with Apartment List user data. Note that domestic migration is just one component of population change, which is also impacted by international migration and natural population change (births minus deaths).↩
Share this Article

