Introducing Our Newest Data Product: Time On Market
Introduction
In recent years the rental market has oscillated rapidly between hot and cold. In 2020, the COVID pandemic brought the multifamily industry to a halt. In 2021, the industry roared back to life as rapid inflation and household formation caused historic rent increases. In 2023, a boom in multifamily construction quieted rent growth once again.
The Apartment List Research Team has published data series that track the rental market through these ups and downs. In 2020 we introduced our newest rent model, which provides near-real-time estimates of median rent in more than 1,000 locations across the country. In 2022 we introduced our vacancy index, summarizing market-level supply-and-demand balance that drives rent growth up or down. And today, we’re introducing a new data series called Time On Market, which describes how long it takes a vacant apartment to get occupied by new tenants. Together, these data products help us understand the continuously evolving multifamily industry.
Understanding Time On Market
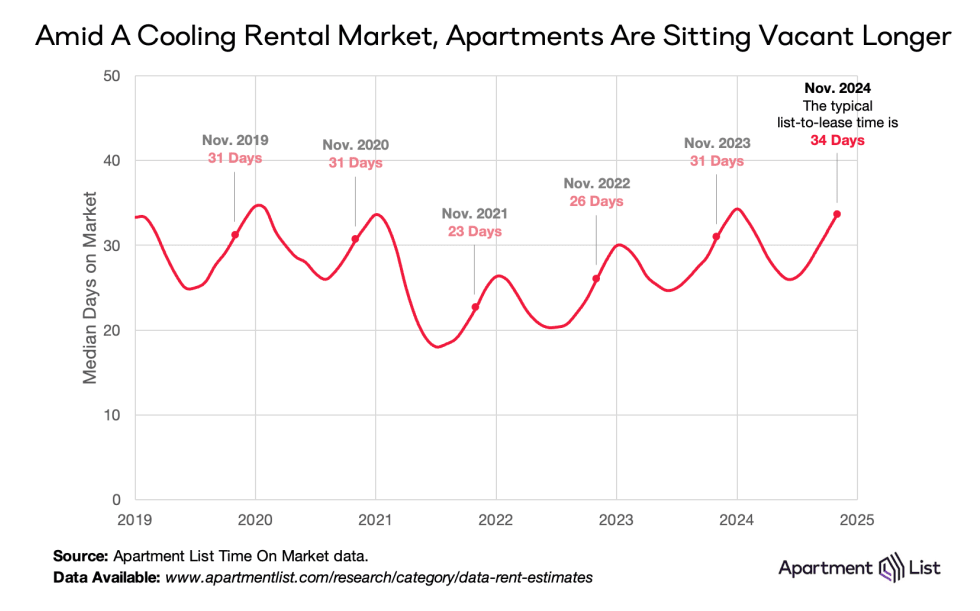
Time On Market is built off of the same underlying dataset that informs our rent model, a sophisticated repeat-rent methodology that monitors price changes between same-unit lease signings. For each leased apartment, we count the number of days between the lease date and the date the apartment was originally listed for rent. In a given month, we present time on market as the median value for all apartments leased during that month. Time on market is available from 2019, and the nationwide trend is presented below.

Two trends jump out immediately. The first is that time on market is highly seasonal. Apartments rent more quickly in the summer when housing demand is high. But during the winter – when there are fewer people moving – it can take up to an extra week to fill a vacant unit. This closely mirrors change in asking rents, which are also highly seasonal.
The second important trend is that time on market has been trending up steadily for three years, a period characterized by rapid apartment construction. During this time, the country has added over 1.3 million new apartments, and another 800,000 remain in the pipeline today. So even as housing demand rebounded from the pandemic, new supply more than kept pace, and apartments are taking a bit longer to fill. According to the latest full month of data, the median time on market for units leased in November 2024 was 34 days, longer than any other November going back to 2019.
Why Does Time On Market Matter?
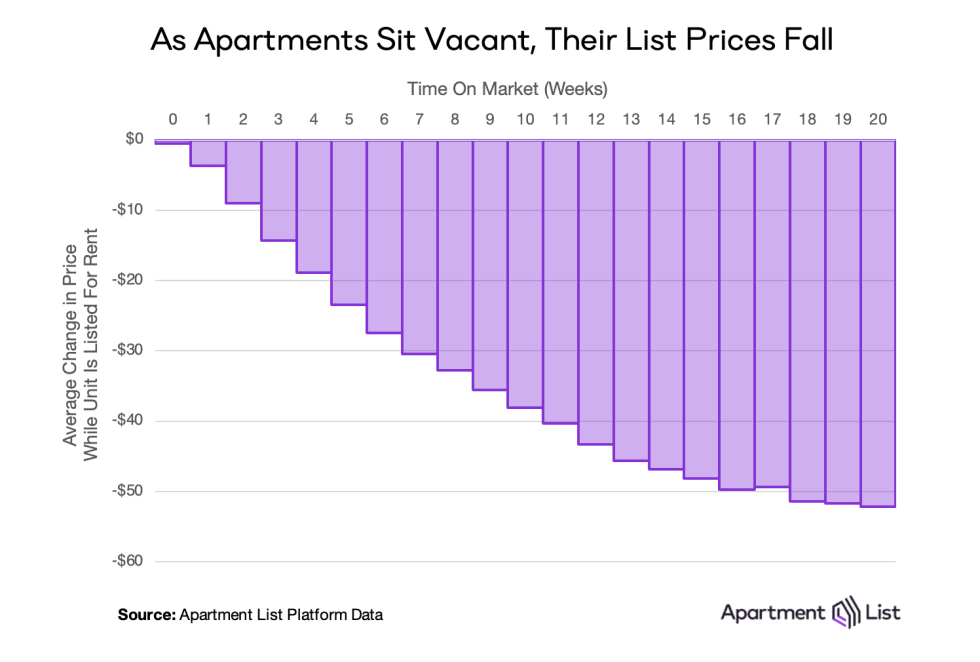
There is a strong relationship between time on market and price. The longer an apartment sits vacant, the more incentive a landlord or property manager has to reduce rent in an effort to attract a new tenant. In the chart below, we see that once a unit sits vacant on our platform for two weeks, its asking rent has dropped $10. For units listed for more than three months, asking rents fall more than $50.

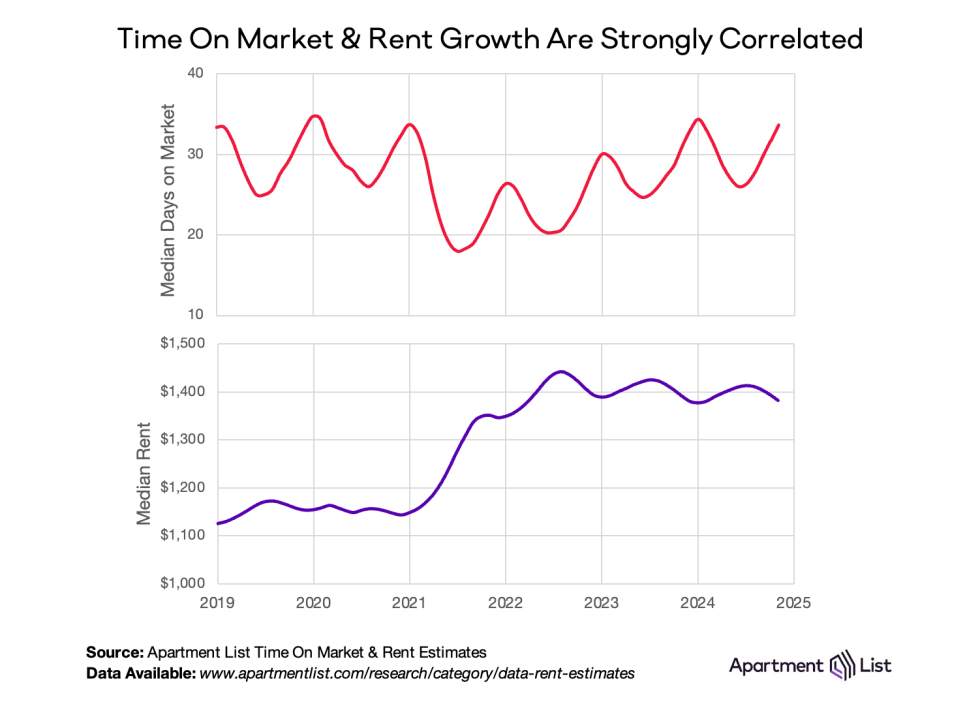
Therefore, we see time on market strongly, negatively correlated with rent growth. If we overlay these two data series – both publicly available on our data downloads page – 2021 stands out immediately. This is when a rapid uptick in new household formation collided with a hobbled construction industry that was still recovering from the pandemic. With high demand but little inventory available, time on market shrunk 46 percent, from a median time of 34 days in January to just 18 days in August. The nationwide median rent, in turn, grew 14 percent during those same months, from $1,148 to $1,310.

But since then, rapid multifamily construction has boosted time on market and suppressed rent growth. We still see seasonal ups-and-downs, but on the whole, time on market is trending up while rents are trending down. As of November 2024, time on market is up 9 percent year-over-year, while rents are down 1 percent.
Exploring The Local Time On Market Data
As is always the case, nationwide trends obscures some important regional differences. Astute users of our data will know that over the past few years, dense rental markets along the coasts have behaved differently than Sun Belt cities, which have behaved differently than Midwestern cities, and so on. Localized time on market data mirrors many of these trends. So like our other data series, we are publishing time on market at several geographic levels: states, metros, counties, and cities. Use the interactive dashboard below to explore the data for yourself.
Since 2020, the Austin metropolitan area has served as the archetypal high-growth rental market. There, time on market appears like an exaggerated version of the national trend, with list-to-lease time more than halving in 2021 and then surging back to new highs in 2024. At its tightest point, the typical apartment in Austin metro was leasing in just over two weeks; today, it is taking nearly a month and a half. Rents have swung accordingly, from a steady-state of 4 percent year-over-year before the pandemic, up to 25 percent in 2021 when time on market was low, and back down to -7 percent today.
Similar trends can be found in other Sun Belt metros where rents were red-hot in 2021 but are much cooler today, such as Phoenix, Raleigh, and Miami.
Markets like Tulsa, Louisville, and Washington DC show the other end of the spectrum. Here, time on market has not rebounded as quickly from pandemic lows, signalling sustained rental demand and/or slower construction activity. Accordingly, these metros are experiencing some of the fastest rent growth in the nation, upwards of 3 percent year-over-year.
Data Access
Like our existing rent and vacancy data series, the new time on market data is available for public download on our website. Our team will continue updating all three series monthly, at the end of each month. For questions about the data, or about the rental market more broadly, we encourage you to reach out to our team directly at research@apartmentlist.com.
Share this Article


