Which cities and states have the most cost-burdened renters?


Background
With the US homeownership rate at its lowest since 1967, the US renter population is the largest it has ever been, and now stands at 43 million households. The share of US renters facing cost burdens, however, has risen steadily in the past 50 years, from 24% in 1960 to 38% in the year 2000. Since then, rents have continued to rise steadily, increasing by 3.2% last year - twice the pace of overall inflation.
The past few years have seen modest increases in renter incomes, but they are still lower than 2001 in inflation adjusted terms. As a result, the share of cost-burdened renters (paying more than 30% of their income on rent) has risen in many cities and states across the nation. According to the census data used in our analysis, the share of cost-burdened renters is 40 percent or higher in all but two states as of 2013.
Data and Methodology
In order to understand how these numbers have changed over time, Apartment List analyzed census data from 2007 - 2014. Renters were divided into three groups:
| Category | Share of Income Spent on Rent |
|---|---|
| Not cost-burdened | Less than 30% |
| Moderately cost-burdened | 30 - 50% |
| Severely cost-burdened | More than 50% |
Our analysis spans 50 states, 454 cities, and 929 counties across the United States. We have included a subset of the data below; please reach out directly if you have questions or require additional data.
Cost-Burdened Renters in the United States, 2007-2014
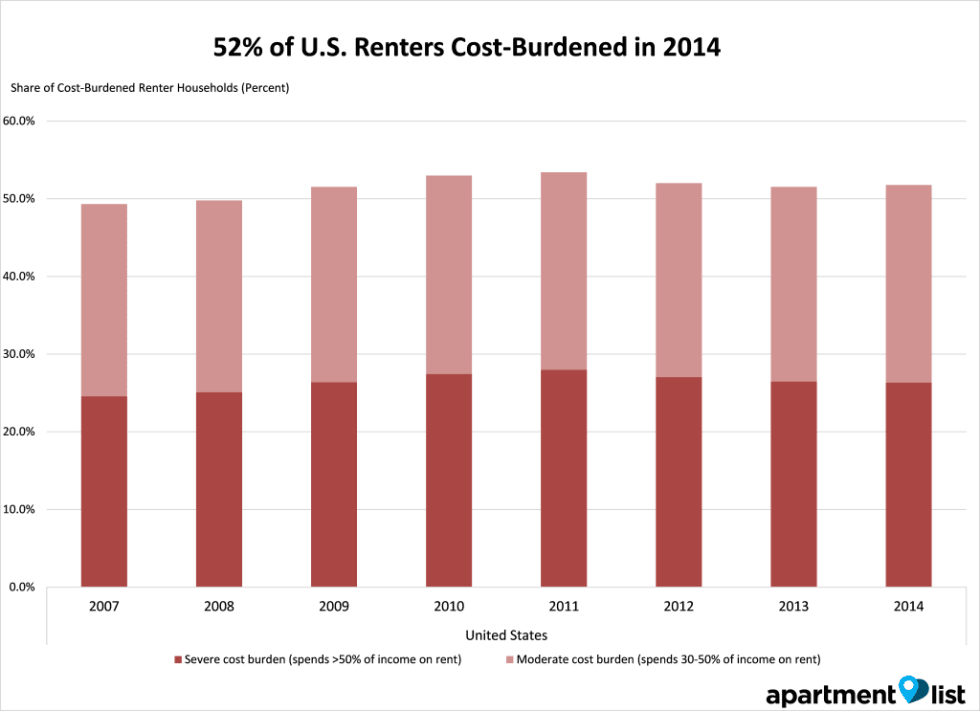 As you can see, the share of cost-burdened renters in the US rose from 49.3% to a high of 53.4% in 2011 - an increase of 1.7 million households. It has fallen a bit since then, but remains higher than pre-recession levels. The share of moderately burdened renters has remained relatively flat during that period, at approximately 25%. The share of severely burdened renters (those spending more than half their income on rent), however, increased markedly from 2007 to 2011, from 24.6% to 28.0%, and before falling back down to 26.3% in 2014.
Nationwide, more than half of renters are cost-burdened, spending more than 30% of their income on rent. More than a quarter of households are severely cost-burdened, with at least half their income going towards rent payments. Most personal finance experts recommend allocating 20-30% of income for rent, ~5% on healthcare, and ~10% for savings; high rents are likely eating into funds that should be set aside for health emergencies, the down payment on a home, or a retirement fund. We expect that this will have a negative impact on homeownership rates in the future.
Renter Incomes vs. Rent in the United States, 2007-2014
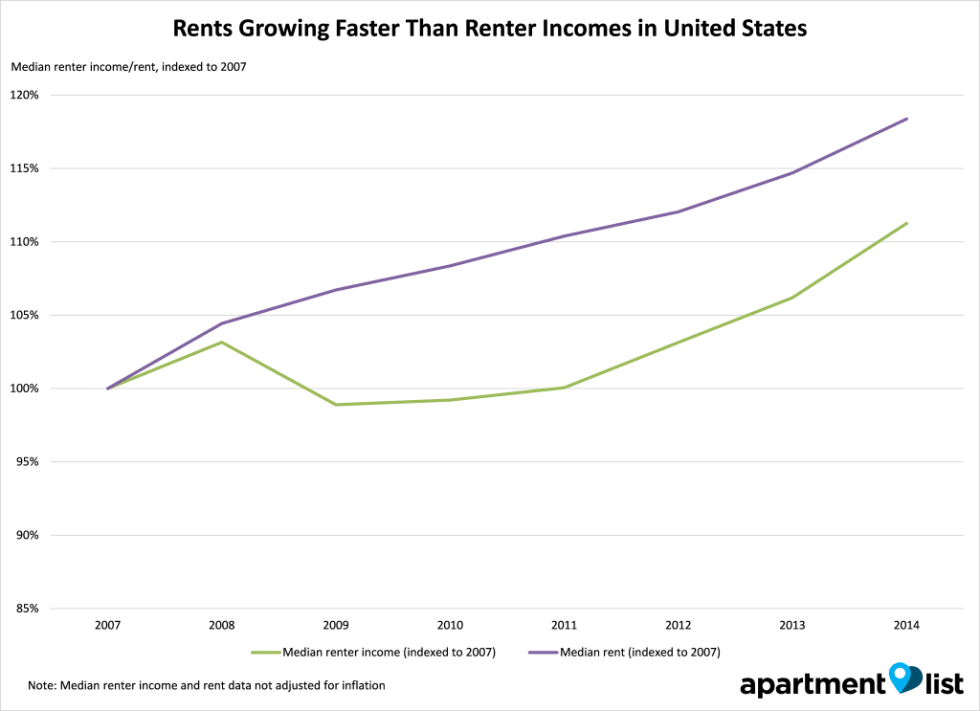 From 2007 to 2014, cost-burden rates increased because renter incomes have not kept pace with the rising rents. Nationwide, rents have increased by a steady 2-3% each year (not adjusted for inflation), whereas renter incomes are essentially flat from 2007-2011. Renter income did increase by ~3% annually from 2011-2013, which narrowed the gap between rents and incomes, but rents still grew 5% more overall than incomes from 2007-2014. This pattern is repeated in many cities and states across the country.
Cost-burdened renters, by state
Next, we looked at the data for each state.
As of 2014, 52% of renters in the United States were cost burdened, but there is significant variation across the country:
- Florida, Hawaii, and California have the worst scores: each of them have cost-burden rates of 57% or higher. 30% of renters there spend more than half their income on rent.
- States on the costly coasts (the Northeast, Southeast, and West Coast) performed most poorly: almost every state there had cost-burden rates higher than the national average.
- The Midwest and Mountain West performed relatively well. The only two states with cost-burden rates of under 40% were North Dakota and South Dakota.
To better understand how these numbers have changed over time, we looked at data from three time periods:
- 2007-2011: Recession and the immediate aftermath
- 2011-2014: The recovery
- 2007-2014: The full period for which we have data, to see the net change for each state
2007 - 2011: After the recession
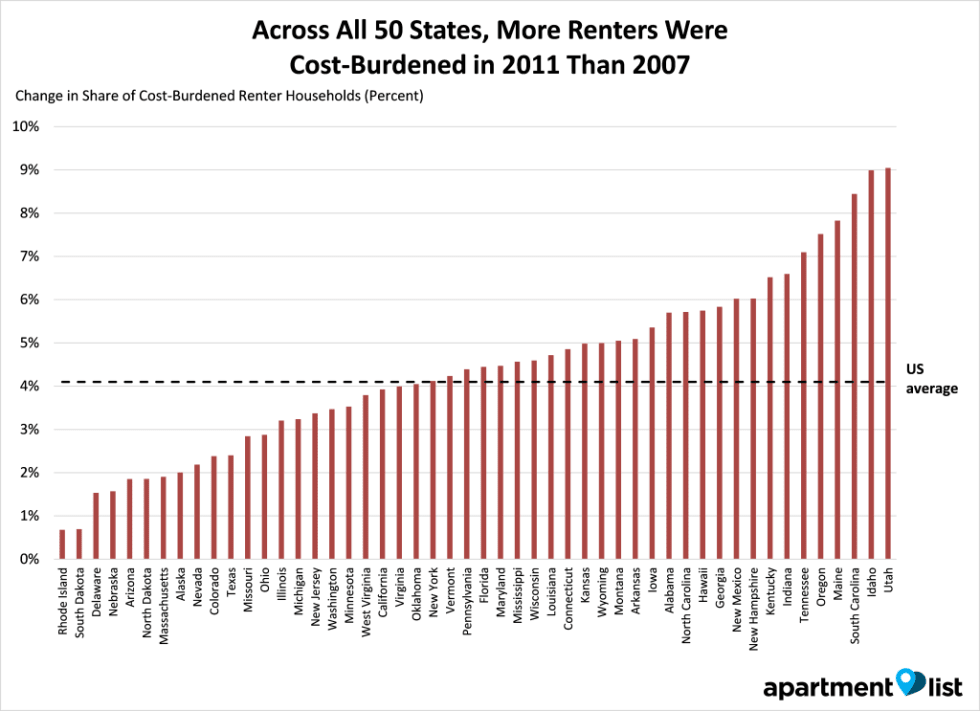
From 2007-2011, every state had their share of cost-burdened renters increase, with Utah, Idaho, and South Carolina seeing increases of more than 8%. Large states like California, Florida, and New York had increases in cost-burden rates of about 4% - right around the national average. Rhode Island and South Dakota had fairly modest increases, with Delaware and Nebraska following close behind. Clearly, the recession hit hard across the country, but some states were affected much more than others.
2011-2014: The recovery
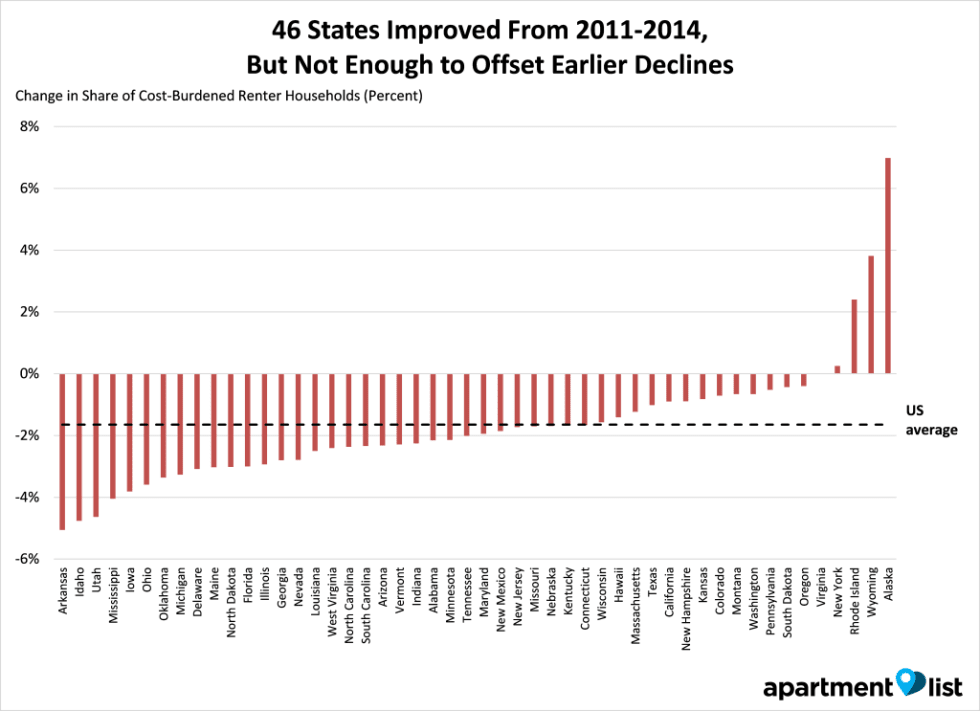 Fortunately, the economy recovered in the next three years, and the share of cost-burdened renters fell in most states. Utah and Idaho, states hardest hit during the recession, reduced their cost-burden rates by 4.6% and 4.8% respectively. Most states saw fairly modest improvement, while states like New York managed to stem its losses, but not reverse them - its share of cost-burdened renters increased 4.1% in the first period and 0.2% in the second.
2007-2014: Overall changes
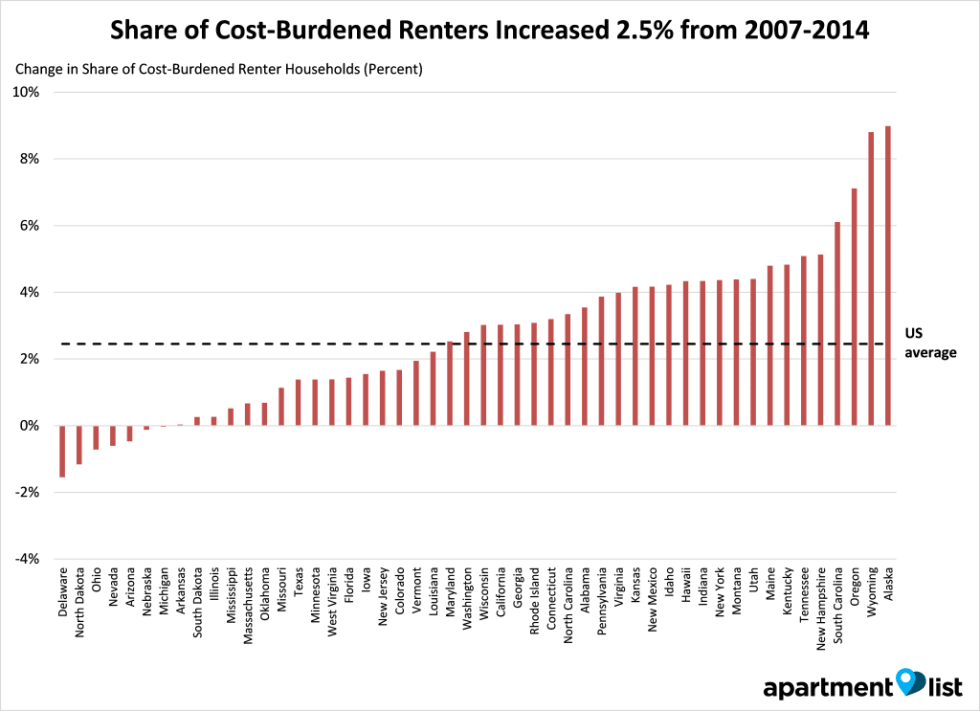 Comparing 2007 with 2014, 43 states had higher shares of cost-burdened renters than before. California and Texas, for example, were able to reverse about a third of the decline, but still ended up with rates 3.0% and 1.4% higher than before the recession. The nationwide average was 52%, representing ~ 24 million renter households facing cost burdens (most of them severely burdened).
Cost-burdened renters, by city
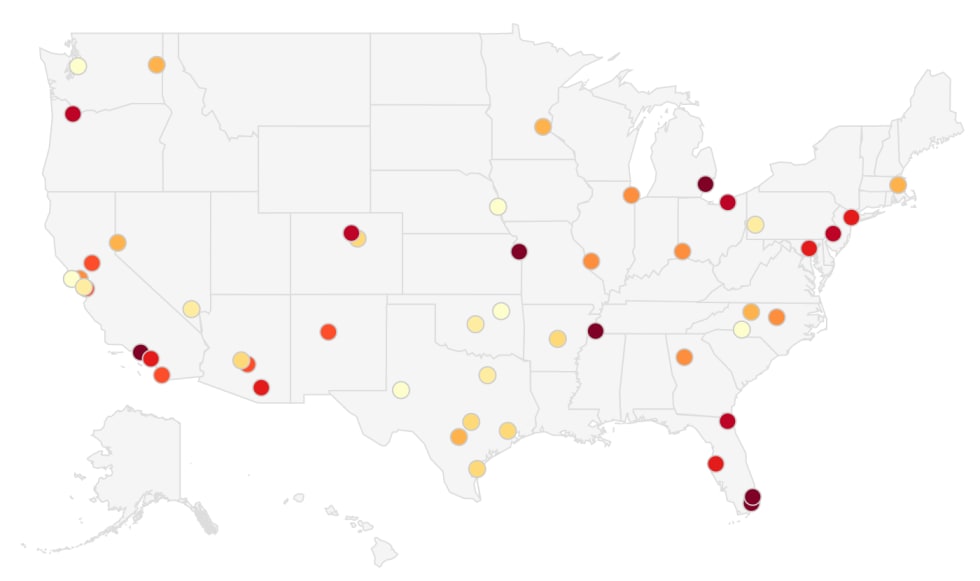

Next, we looked at which cities in the United States have the most cost-burdened renters in 2014.
The biggest surprise here was San Francisco, which has the lowest share of cost-burdened renters among the 50 cities we examined. With rents skyrocketing in recent years, we expected some of the highest cost burdens to be in the Bay Area, but apparently the combination of rent control and increasing wages in the city have done enough to minimize the pain. We see similar results in other cities that millennials are flocking to - Seattle, Dallas, Austin, Houston, and Denver all ranked in the top 15 of our list, with 50% or fewer renters paying at least 30% of their income in rent. Las Vegas (-4.2%), Columbus (-3.8%), and El Paso (-3.1%) saw some of the biggest reductions in cost burden rates, and are now relatively affordable places to live.
Most other big cities, however, didn't fare as well: Boston (52%), Chicago (53%), San Diego (55%), New York City (55%), and Portland (57%) all had cost-burden rates higher than the national average. New York City (+7.2%), Portland (+4.8%), and Memphis (+4.0%) saw cost-burden rates increase significantly, and are now some of the most unaffordable cities for renters.
At the bottom of the table were Miami, Detroit, and Los Angeles. Each of these cities have more than 60% of their renters facing cost burdens, and Miami has an incredible 37% of renters paying at least half their income in rent - ouch! Each of these cities have made up some ground since the recession, but continue to be challenging places for renters to live.
Median Rent vs. Renter Income in San Francisco, Denver, Austin, and Seattle
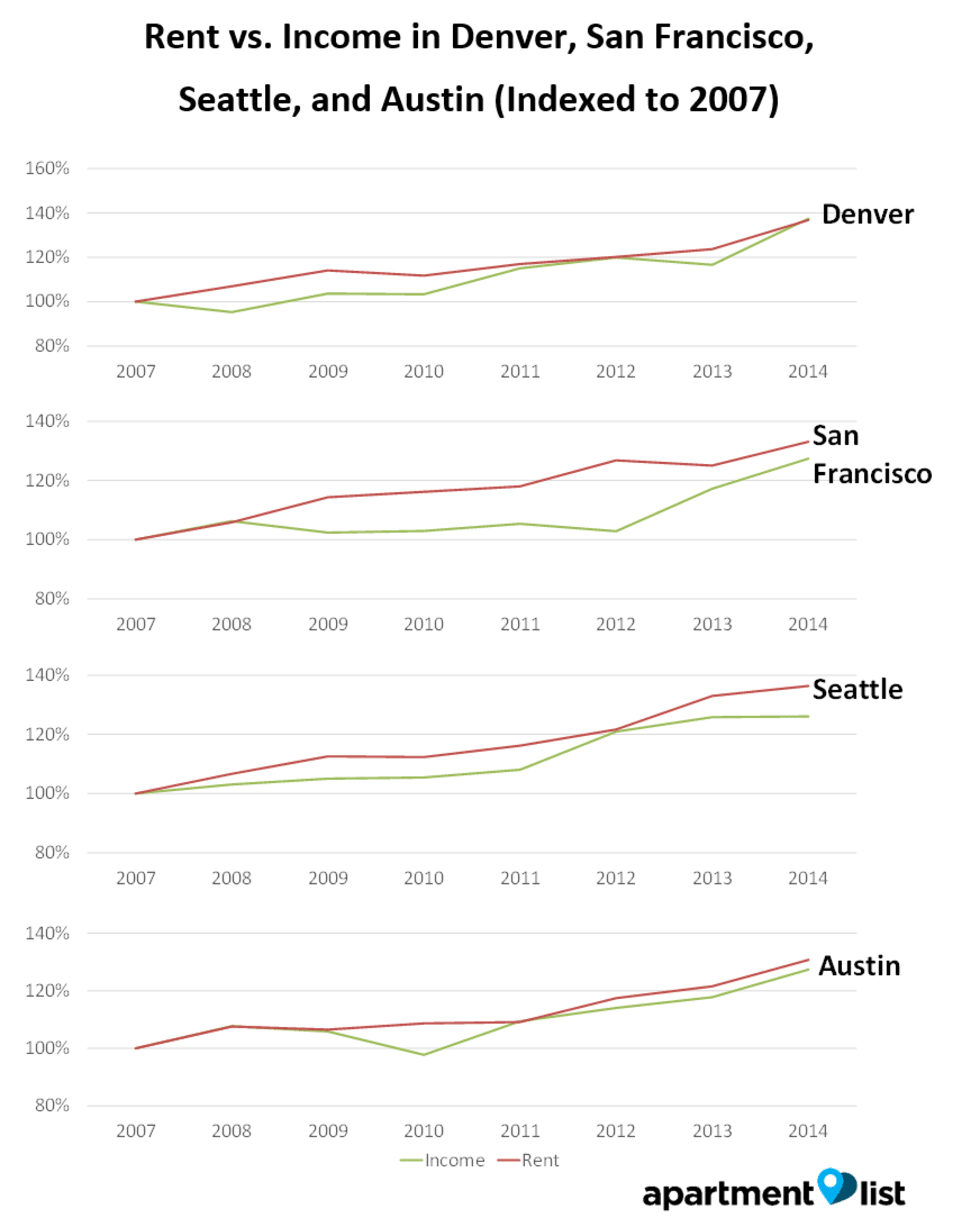
Looking at median renter income and median rent rates for each city, we start to understand why some cities fare better than others. San Francisco, Denver, Austin, and Seattle, for example, all had rapidly increasing rents of 30-40% from 2007 to 2014, but median incomes (mostly) kept pace, which allowed renter cost-burden rates to stay relatively low. In Denver, for example, the median rent increased from $726 to $993 (37%!), but median renter incomes rose from $28K to $39K, also a 37% increase. Rising rents still present challenges, especially for those whose incomes have not risen, but a strong economy and employment growth have largely kept cost-burden rates at bay.
Median Rent vs. Renter Income in Los Angeles, New York City, Detroit, and Memphis
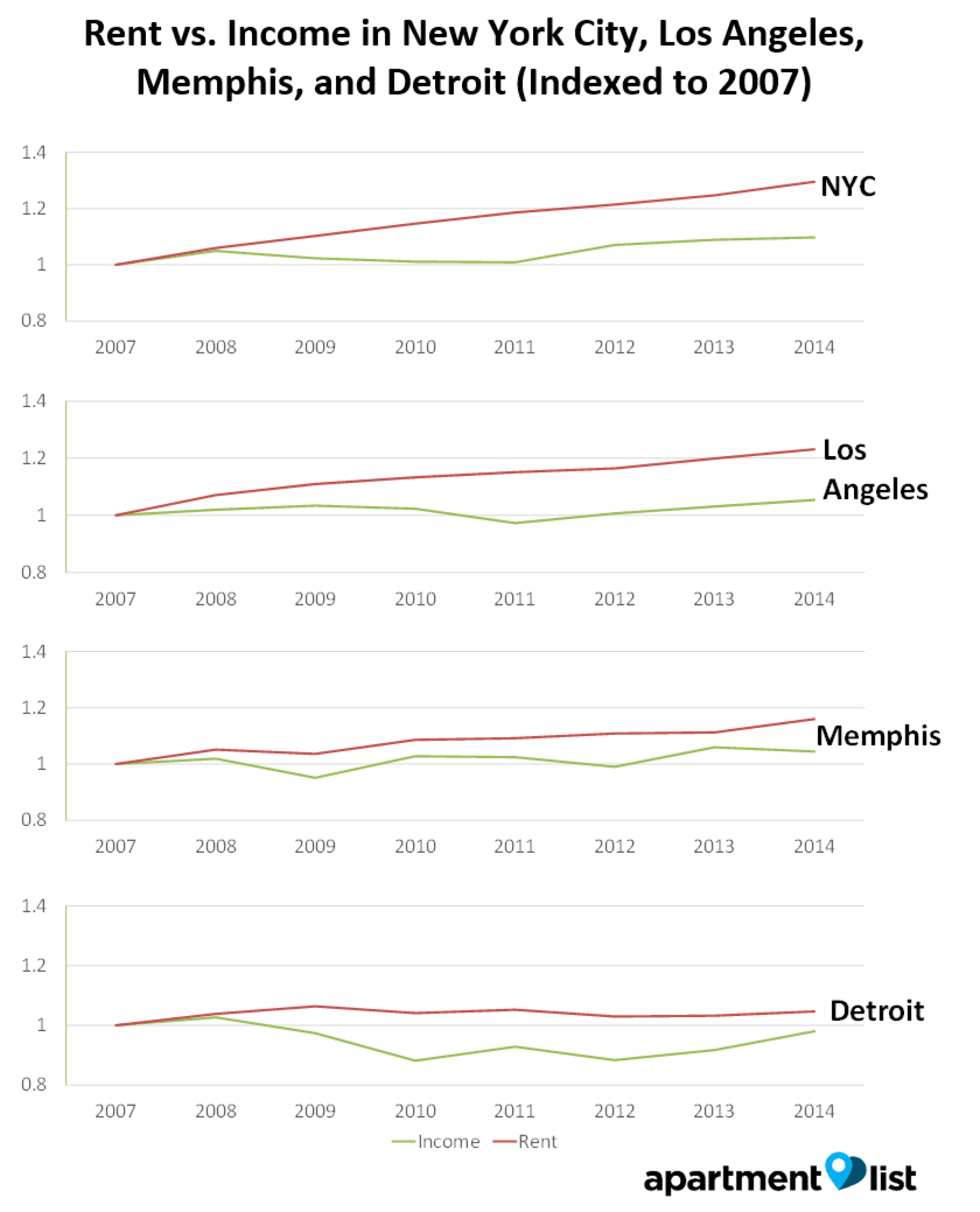
On the other side of the spectrum are cities where rents have increased relatively slowly, but flat or declining renter incomes have resulted in an increase in cost-burden rates. Median rents in Detroit, for example, have barely budged since 2008 ($737 in 2014 vs $731 in 2008), but median renter incomes have actually declined in nominal terms, from $17,685 to $17,340. The situation is even worse in Los Angeles and New York City, where rents have risen by 20-30%, but incomes have not kept up.
Conclusion
Contrary to popular belief, renter cost burdens are not solely a "big city" phenomenon - more than 40% of renters in 48 states are cost-burdened, and the fact that Fresno, Tucson, and Milwaukee are among the poorest performers (and San Francisco one of the best) suggests that the problem is as much one of low wages as it is high rents. Cost-burden rates are still more than 10% higher than in 2000, and the JCHS forecasts that the number of cost-burdened renter households will continue to increase in coming years.
It's encouraging, however, that renters appear to be doing better since 2011. Cost-burden rates are down in most cities and states, and hopefully the explosion in rents that we've seen in many cities across the nation will abate as new construction is finished. As always, we at Apartment List are here to help renters find the perfect place to live!
Renter cost burdens by state, 2007-2014
| State | 2007 | 2008 | 2009 | 2010 | 2011 | 2012 | 2013 | 2014 |
|---|---|---|---|---|---|---|---|---|
| United States | 49.3% | 49.8% | 51.5% | 53.0% | 53.4% | 52.0% | 51.5% | 51.8% |
| Alabama | 48.1% | 48.1% | 51.6% | 54.0% | 53.8% | 49.8% | 50.0% | 51.7% |
| Alaska | 42.3% | 42.7% | 40.9% | 47.5% | 44.3% | 47.4% | 43.2% | 51.3% |
| Arizona | 50.1% | 50.2% | 51.8% | 53.2% | 51.9% | 51.4% | 49.6% | 49.6% |
| Arkansas | 47.5% | 48.2% | 48.5% | 49.7% | 52.6% | 48.9% | 48.3% | 47.5% |
| California | 53.7% | 54.7% | 55.4% | 57.2% | 57.7% | 57.6% | 57.1% | 56.8% |
| Colorado | 49.2% | 50.1% | 52.5% | 52.2% | 51.6% | 51.0% | 51.9% | 50.9% |
| Connecticut | 50.4% | 51.2% | 52.6% | 53.7% | 55.2% | 53.0% | 52.9% | 53.6% |
| Delaware | 51.2% | 51.4% | 52.8% | 55.2% | 52.7% | 48.6% | 51.1% | 49.6% |
| Florida | 56.4% | 57.5% | 60.3% | 60.4% | 60.9% | 58.6% | 57.8% | 57.9% |
Cost-Burdened Renters by City, 2007-2014
| 2014 rank | City | 2007 | 2008 | 2009 | 2010 | 2011 | 2012 | 2013 | 2014 |
|---|---|---|---|---|---|---|---|---|---|
| 1 | San Francisco, CA | 42.7% | 42.7% | 45.0% | 46.2% | 45.2% | 47.7% | 44.7% | 42.5% |
| 2 | Midland, TX | 49.0% | 43.9% | 51.3% | 43.1% | 47.5% | 42.8% | 45.6% | 43.5% |
| 3 | Charlotte, NC | 47.2% | 42.6% | 47.0% | 51.8% | 53.4% | 48.4% | 49.0% | 46.0% |
| 4 | Seattle, WA | 45.3% | 47.7% | 47.0% | 48.7% | 48.7% | 46.1% | 45.3% | 46.0% |
| 5 | Tulsa, OK | 48.0% | 47.3% | 47.3% | 50.4% | 51.3% | 49.2% | 45.9% | 46.0% |
| 6 | Omaha, NE | 47.5% | 47.8% | 48.2% | 50.0% | 49.3% | 48.3% | 50.9% | 47.3% |
| 7 | Oklahoma City, OK | 45.5% | 47.3% | 50.8% | 50.0% | 52.7% | 53.5% | 46.6% | 47.5% |
| 8 | Dallas, TX | 45.7% | 51.6% | 50.4% | 49.3% | 48.0% | 47.3% | 48.3% | 48.5% |
| 9 | Washington, DC | 48.4% | 47.5% | 49.1% | 50.7% | 49.3% | 48.1% | 49.5% | 48.6% |
| 10 | Las Vegas, NV | 53.6% | 53.4% | 56.2% | 53.8% | 53.2% | 51.1% | 53.7% | 49.4% |
Share this Article
