100+ U.S. Rent Statistics and Trends [2025]
The U.S. rental market is in flux. Economic uncertainty, shifting demographics, and changing renter priorities have redrawn the housing landscape, influencing where people live and what they can afford. Even as rent growth cools in some regions, affordability remains a pressing concern, with cost burdens reaching record highs.
This report unpacks the latest data on rent prices, migration trends, and the financial strains shaping today’s rental market. Whether you’re a tenant weighing your next move, an investor assessing risk, or a policymaker confronting the affordability crisis, these insights offer a clear-eyed look at the forces reshaping housing in America.
100+ U.S. Rent Statistics and Trends
Key Statistics and Insights
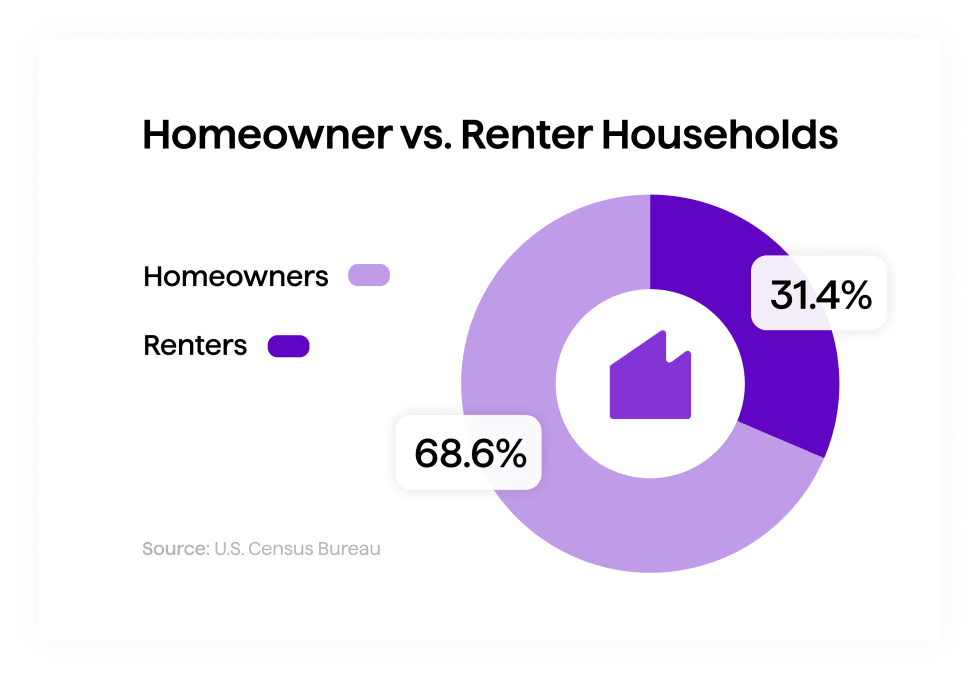
- 31.4% of Americans rent—that’s 102.7 million people living in rentals.
- Median U.S. rent is $1,370, with San Francisco ($2,561) and New York ($2,194) among the highest.
- Texas leads in migration with 85,000 net movers, while California and New York see the most outflows.
- Buying a home costs $1,091 more per month than renting an apartment.
- 51.8% of renters are cost-burdened, spending over 30% of income on rent—Florida has the highest rate.
- Time on market is up 9% year-over-year, reaching 36 days in early 2025.
- The U.S. lacks 7.3 million affordable rentals, with just 34 available per 100 low-income households.
How Many People Rent in the U.S.?
Approximately 102.7 million people in the United States live in renter-occupied housing, making up nearly 31.4% of the total population. In contrast, 224 million people reside in owner-occupied homes, highlighting that homeownership remains the dominant choice.
Despite this, renting continues to play a crucial role in the market, offering flexibility and affordability in an era of rising home prices. With economic factors, migration trends, and shifting lifestyle preferences shaping housing decisions, the demand for rental properties remains strong—particularly among younger generations, urban dwellers, and those facing financial barriers to homeownership.
Median Rent in the U.S.
The median rent in the U.S. is $1,370, though prices vary by city and region. The table below details current median rent prices to help compare costs across different markets.1
| Population Rank | Metropolitan Area | Median Rent, February 2025 |
|---|---|---|
| 1 | New York-Newark-Jersey City, NY-NJ-PA | $2,194 |
| 2 | Los Angeles-Long Beach-Anaheim, CA | $2,189 |
| 3 | Chicago-Naperville-Elgin, IL-IN-WI | $1,604 |
| 4 | Dallas-Fort Worth-Arlington, TX | $1,428 |
| 5 | Houston-The Woodlands-Sugar Land, TX | $1,353 |
| 6 | Washington-Arlington-Alexandria, DC-VA-MD-WV | $2,167 |
| 7 | Philadelphia-Camden-Wilmington, PA-NJ-DE-MD | $1,525 |
| 8 | Miami-Fort Lauderdale-Pompano Beach, FL | $1,811 |
| 9 | Atlanta-Sandy Springs-Alpharetta, GA | $1,442 |
| 10 | Boston-Cambridge-Newton, MA-NH | $2,150 |
Where Are Renters Moving?
Our Renter Migration Report reveals shifting migration trends across the U.S. in recent years.
Here’s an overview of where renters are looking to move and which states are seeing the most inflows and outflows.2
- Cross-metro moves have stabilized at 39% in 2024, maintaining the decline from 2021 levels.
- Cross-state moves remain steady at 25%, down from the pandemic highs.
- California and New York continue to see outflows, but migration away from these states is slowing.
- Top out-migration states: California, New York, Illinois, New Jersey, and Massachusetts.
- Top in-migration states: Texas (85,000 net domestic movers), Florida, North Carolina, South Carolina, and Tennessee.
- South Carolina recorded the highest percentage growth from migration.
- Popular destinations for California movers: Texas (12.4%), Nevada, Arizona, Washington, and Colorado. Florida saw decreased interest from Californians year over year.
- Popular destinations for New Yorkers: New Jersey remains the top destination, followed by Florida and Texas.
- Texas draws renters from California, Florida, New York, Illinois, and Louisiana.
- Florida’s top inbound sources are New York, Georgia, Texas, California, and Pennsylvania.
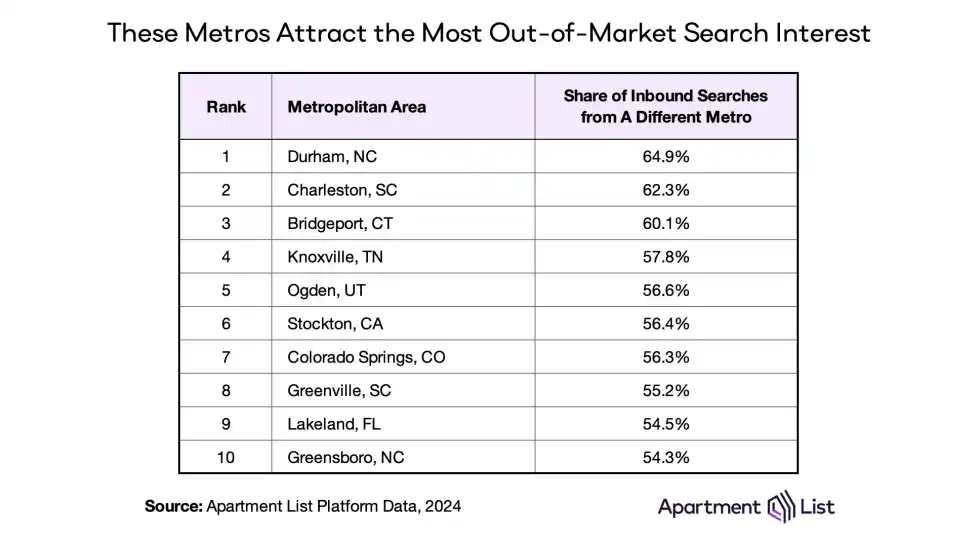
- Metro-level migration patterns: Durham, NC (65%), Charleston, SC (62%), and Lakeland, FL attract the highest share of out-of-market searches.
- Renters priced out of expensive markets continue to search in more affordable neighboring areas:
- Migration patterns show a continued trend toward lower-density, lower-cost regions, particularly in the Sunbelt and the Mountain West.
- While affordability remains a key driver, the impact of remote work may be waning, affecting long-term migration patterns.
How Much Is Renters Insurance?
The average cost of renters insurance in the U.S. is $23 per month,3 but rates vary depending on location. Factors like regional weather risks, crime rates, and coverage limits influence how much you’ll pay. Unlike homeowners insurance, renters insurance covers only your personal belongings and not the structure itself. Policies clearly outline what’s covered, so it’s important to review the details before an emergency arises.
Renters Insurance Premiums by State
The table below provides a state-by-state breakdown of renters insurance premiums.4
| State | Average Premium |
|---|---|
| Alabama | $222 |
| Alaska | $184 |
| Arizona | $160 |
| Arkansas | $206 |
| California | $177 |
| Colorado | $159 |
| Connecticut | $171 |
| Delaware | $144 |
| District of Columbia | $150 |
| Florida | $175 |
Time on Market
How long can you expect a future rental or vacant property to be on the market? With shifts in supply, demand, and seasonality, the answer is changing.
Here’s the latest data on how time on market is evolving across the country.5
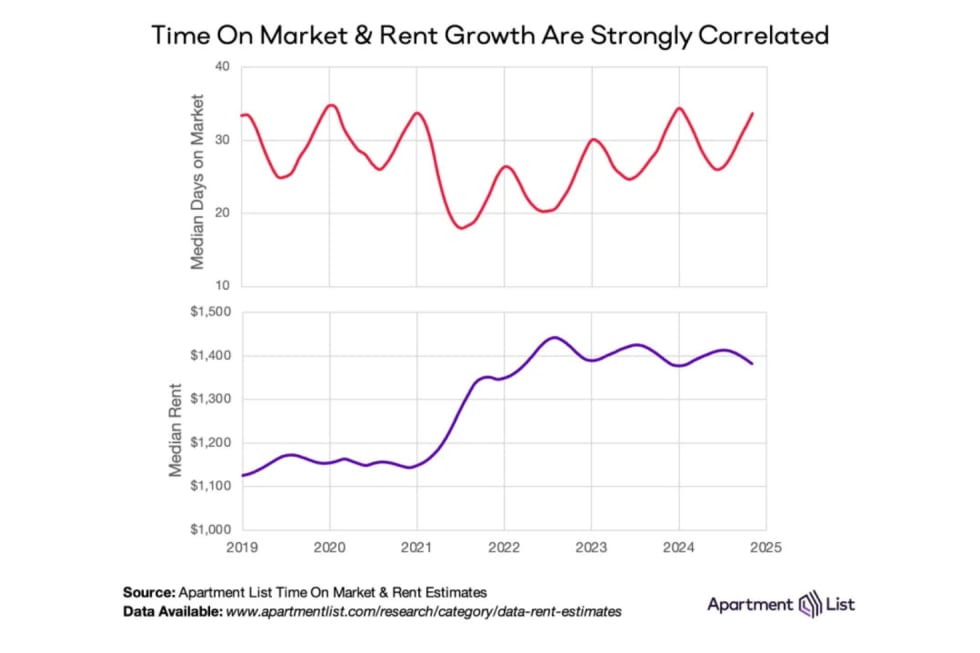
- The median time on market for apartments in February 2025 was 36 days, the highest for any February since we started tracking time on market in 2019.
- As of February 2025, time on market is up more than 9% year over year.
- Apartments vacant for more than three months saw average rent cuts of over $50.
- In Austin, TX, time on market rose from just over two weeks in 2021 to over 1.5 months in early 2025.
Apartment Renting vs. Homeownership
Homeownership and renting offer distinct advantages. Homeownership provides stability, potential equity growth, and customization but comes with higher upfront costs, maintenance, and market risks.
Renting, on the other hand, offers flexibility and lower initial expenses, making it ideal for frequent movers or those avoiding upkeep. In late 2024, rental vacancy rates stood at 6.9%, compared to just 1.1% for homeowners.
Homeownership rates vary by region, with the Midwest leading at 70.3% in early 2023, followed by the South (67.3%), Northeast (62.7%), and West (61.9%). Despite its long-term investment potential, buying a home remains costly—averaging $1,091 more per month than renting in 2024.6
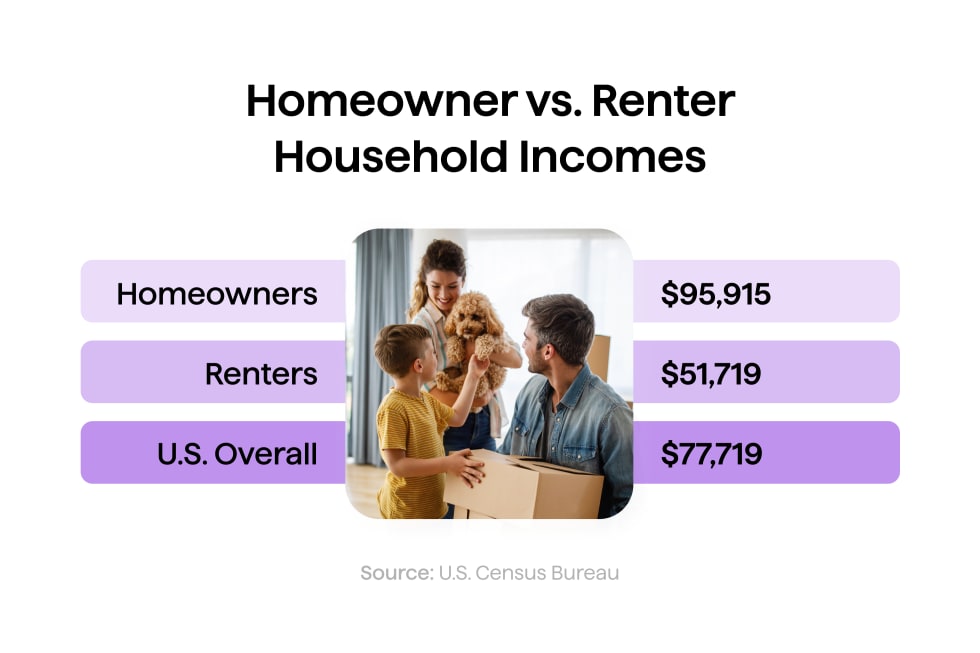
Renter and Homeowner Identities
Understanding these shifts can provide insight into economic stability, wealth disparities, and demographic shifts between homeowners and renters.
- Median annual household income for homeowners is $95,915 compared to renters’ $51,719.
- In 2022, single women owned 58% of the nearly 35.2 million homes7 owned by unmarried Americans, while single men owned 42%.
- 67% of households8 that rent are made up of single persons, single-parent families, and nonfamily households.
- In 2021, the median age for renters was 43 compared to 57 for homeowners.9
- 55% of Black- or African American-led households are renters.
- 41% of Hispanic- or Latino-led households are renters.
- 36.5% of Asian-led households are renters.
- 26% of non-Hispanic White adult-led households are renters.
Renter Demographics
Renter demographics in the U.S. reflect shifting social and economic dynamics, from the prevalence of married-couple households to the rising number of young adults living with their parents.
Renters and Homeowners by Household Income
Review the following metrics to see how homeownership and rental rates vary across different income levels.10
| Household Income | Homeownership Rate | Rental Rate |
|---|---|---|
| Less than $5,000 | 41.7% | 58.3% |
| $5,000 to $9,999 | 39.3% | 60.7% |
| $10,000 to $14,999 | 37.9% | 62.1% |
| $15,000 to $19,999 | 45.5% | 54.5% |
| $20,000 to $24,999 | 48.2% | 51.8% |
| $25,000 to $34,999 | 50.8% | 49.2% |
| $35,000 to $49,999 | 54.7% | 45.3% |
| $50,000 to $74,999 | 60.5% | 39.5% |
| $75,000 to $99,999 | 67.6% | 32.4% |
| $100,000 to $149,999 | 75.6% | 24.4% |
Renters and Homeowners by Age Group
Use the table below to grasp how renting and homeownership trends shift by age group.11
| Householder Age | Homeownership Rate | Rental Rate |
|---|---|---|
| 15 to 24 years | 16.2% | 83.8% |
| 25 to 34 years | 41.3% | 58.7% |
| 35 to 44 years | 61.1% | 38.9% |
| 45 to 54 years | 69.9% | 30.1% |
| 55 to 59 years | 74.3% | 25.7% |
| 60 to 64 years | 76.5% | 23.5% |
| 65 to 74 years | 79.1% | 20.9% |
| 75 to 84 years | 79.8% | 20.2% |
| 85 years and over | 71.7% | 28.3% |
Renter and Homeowner Household Sizes by State
Explore this table to compare the average household sizes of renters and homeowners across states.12
| State | Household Size (Owner-Occupied Homes) | Household Size (Renter-Occupied Homes) |
|---|---|---|
| Alabama | 2.52 | 2.19 |
| Alaska | 2.70 | 2.23 |
| Arizona | 2.57 | 2.34 |
| Arkansas | 2.52 | 2.21 |
| California | 2.90 | 2.62 |
| Colorado | 2.51 | 2.10 |
| Connecticut | 2.61 | 2.11 |
| Delaware | 2.53 | 2.21 |
| District of Columbia | 2.21 | 1.73 |
| Florida | 2.51 | 2.38 |
Renter Preferences
Understanding renters' priorities identifies the financial, technological, and lifestyle amenities they value most. These insights from Apartment List’s internal data, the NMHC, and Appfolio help shape the future of rental housing by addressing both practical needs and aspirational living preferences.
- 93% of renters are looking for practical items including in-unit washer/dryer and air conditioning.
- High-speed internet was required by 90% of renters, and 86% required a home with reliable mobile reception.
- Soundproof walls (88%) and noise-reducing windowpanes (83%) are highly sought after.
- 66% of renters note the importance of neighbors adhering to community rules.
- 35% of renters plan to move within the next 12 months because of being dissatisfied with property management.
- Renters who are happy with apartment maintenance are 25% less likely to leave.
- 88% of renters say a property manager’s reputation on review sites is important when evaluating a rental before signing a lease.
- 95% of renters value clear and transparent listings.
- 75% of renters consider an online resident portal/mobile app essential for managing their rental.
- 84% of renters prioritize online rent payments.
- 66% consider flexible rent payment options important.
- 73% of renters value rent reporting programs.
- 70% say a renter rewards program would be beneficial.
- 51% of renters move to find lower rent.
- 39% move seeking better amenities.
- 32% move for a better community.
- 60% of renters stay because they’re happy with their unit.
- 54% say moving is too expensive.
- 46% would face higher rent if they moved.
- 43% are satisfied with their property manager/landlord.
Rental Vacancy Rates
As of February 2025, vacancies range from 4.2% in Riverside to 10.5% in Birmingham, showcasing stark regional contrasts.
Texas cities like Austin (9.8%), San Antonio (9.1%), and Dallas (8.6%) are seeing more empty units, likely due to a surge in new construction. Meanwhile, tight markets such as New York (4.9%), San Francisco (4.8%), and Los Angeles (5.1%) suggest steady demand and limited availability.
For renters, high-vacancy cities offer better deals and incentives. In competitive markets, expect fewer choices and firmer pricing.
The statistics below are for the 50 largest metropolitan areas.13
| Population Rank | Metropolitan Area | Multifamily Vacancy Rate, February 2025 |
|---|---|---|
| 1 | New York-Newark-Jersey City, NY-NJ-PA | 4.9% |
| 2 | Los Angeles-Long Beach-Anaheim, CA | 5.1% |
| 3 | Chicago-Naperville-Elgin, IL-IN-WI | 5.0% |
| 4 | Dallas-Fort Worth-Arlington, TX | 8.6% |
| 5 | Houston-The Woodlands-Sugar Land, TX | 8.0% |
| 6 | Washington-Arlington-Alexandria, DC-VA-MD-WV | 5.4% |
| 7 | Miami-Fort Lauderdale-Pompano Beach, FL | 5.7% |
| 8 | Philadelphia-Camden-Wilmington, PA-NJ-DE-MD | 5.4% |
| 9 | Atlanta-Sandy Springs-Alpharetta, GA | 7.6% |
| 10 | Phoenix-Mesa-Chandler, AZ | 7.7% |
Most Common Types of Rental Properties
Renters in the U.S. live in a diverse range of housing types, from single-family homes to high-rise apartment buildings. Nearly 50% of rental properties are single-family homes, providing space and privacy often sought by families and long-term renters. Apartments remain a major option, with 39% of renters choosing this type of residence. Notably, 61.5% of renters live in buildings with two or more units, underscoring the prevalence of multi-unit housing in urban and suburban areas.
Smaller rental buildings, such as duplexes and triplexes, account for a total of 17.4% of the market, while larger complexes with 50 or more units house over 7.4 million renters. Mobile homes also provide an alternative for 4% of renters. While rare, unconventional living spaces like boats, RVs, and vans accommodate a small fraction of renters.
Apartment Utility Costs by City
The average cost of apartment utilities in the U.S. is $253.14 per month.14 Use the table below to see how utility costs compare across major cities nationwide.
| City | Average Electricity Cost | Average Gas Cost | Average Water Cost | Average Fuel Cost | Average Total Cost |
|---|---|---|---|---|---|
| Albuquerque, NM | 200.70 | 82.63 | 36.51 | 43.70 | 363.54 |
| Allentown, PA | 188.62 | 73.60 | 71.34 | 1.10 | 334.67 |
| Atlanta, GA | 170.47 | 65.56 | 37.89 | 34.41 | 308.33 |
| Austin, TX | 189.62 | 59.63 | 55.72 | 1.53 | 306.49 |
| Bakersfield, CA | 162.39 | 53.23 | 36.59 | 46.50 | 298.71 |
| Baltimore, MD | 161.06 | 62.00 | 33.60 | 37.41 | 294.07 |
| Baton Rouge, LA | 148.25 | 69.07 | 72.70 | 2.03 | 292.06 |
| Birmingham, AL | 192.64 | 46.11 | 51.61 | 0.97 | 291.32 |
| Boise City, ID | 144.05 | 63.79 | 82.88 | 0.42 | 291.14 |
| Boston, MA | 145.15 | 76.62 | 41.45 | 27.22 | 290.44 |
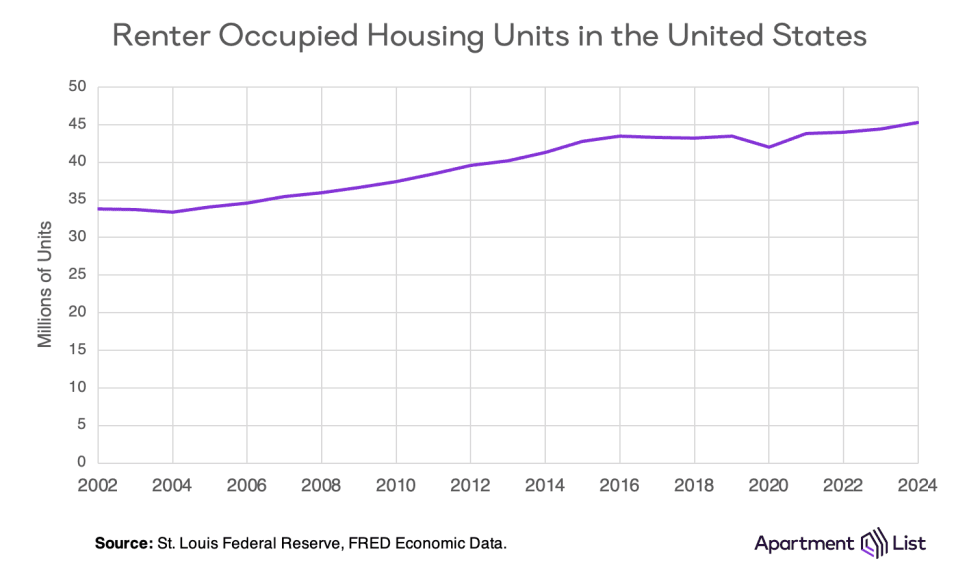
Renter-Occupied Housing Over Time
The number of renter-occupied housing units in the U.S. has steadily grown over the past two decades, rising from around 35 million in the early 2000s to over 45 million in 2024.15
Length of Rental Leases
As of 2025, 12-month leases remain the most common rental lease duration, accounting for 59.6% of rental agreements. Month-to-month leases follow, making up 31.8%, reflecting a growing preference for flexibility among renters.16
| Lease Length | Share of Leases |
|---|---|
| Month-to-month | 31.8% |
| 6 months | 1.1% |
| 12 months | 59.6% |
| 24 months | 2.6% |
| Other length | 5.0% |
Rent Control
Rent control policies are government regulations that limit the amount landlords can increase rent over time, which aims to keep housing affordable.
A study examining San Francisco’s rent control17 expansion found that while tenants benefited from reduced rent increases and greater housing stability, landlords often responded by converting rental units to condominiums or other uses.
This led to a 15% decrease in the city’s total rental supply and a 7% increase in overall rents, emphasizing the unintended consequences of such policies.
As of 2024, over 305 local governments in the U.S. have enacted some form of rent control.
Jurisdictions with Stricter Rent Caps:
- California: The state's Tenant Protection Act of 201918 limits annual rent increases to 5% plus the local inflation rate, with a maximum cap of 10%.
- Oregon: In 2019, Oregon became the first state to enact statewide rent control,19 capping annual rent increases at 7% plus inflation.
- New York: New York City has one of the most extensive rent regulation systems in the United States, covering nearly half of its rental stock.20
Jurisdictions with More Flexible or No Rent Control Policies:
- Texas: The state prohibits cities from enacting rent control policies unless authorized by state law, making it one of the most landlord-friendly states.21
- Arizona: Statewide preemption laws22 prohibit cities from enforcing rent caps or rent control policies.
- Tennessee: State law23 prevents local governments from implementing rent control measures.
Affordable Housing
Affordable housing ensures that individuals and families with low to moderate incomes can secure safe and stable living conditions. Unfortunately, a significant portion of the U.S. population faces challenges in finding affordable options.
- The U.S. has a shortage of 7.3 million rental homes24 affordable and available to renters with extremely low incomes.
- For every 100 homes, there are only 34 available for low-income renter households.25
- Nearly 42.9 million American households26 were burdened by the cost of housing in 2023.
- Federal rental assistance programs help about 5 million low-income households27 to rent at an affordable cost.
- 50% of federally assisted households live in urban neighborhoods, 31% live in suburban neighborhoods, and just under one-fifth live in rural areas.28
- The number of renters earning at least $75,000 rose by 48% over the past decade,29 making it harder for lower-income renters to compete.
- 4.6 million renters30 receive HUD subsidies, with an average income of just $15,000.
Cost-Burdened Renters
Housing affordability remains a growing challenge for renters across the U.S., with rent costs outpacing income in many major metros. The following metrics reflect the rise in rent burden, the regions most affected, and how these trends have evolved in recent years.
- 22 million renter households in the U.S. spent over 30% of their income on rent as of 2023, a record high.
- 51.8% of U.S. renters were cost-burdened in 2023, with 26.4% severely burdened, spending more than half their gross income on rent.
- The number of cost-burdened renters rose by 226,000 in 2023.
- There are 2.1 million more cost-burdened renters in 2023 compared to 2019.
- Florida leads the nation in rent burden, with 62% of renters cost-burdened.
- Cape Coral, FL, has the highest rent burden rate at 67%, followed by Miami (65%) and Tampa (61%).
- Seven of the top 10 metros with the highest rent burden are in Florida.
- Tampa’s rent burden jumped to 61% in 2023, driven by a 49% rent increase.
- Phoenix saw the second-largest increase in rent burden, from 46.6% in 2019 to 54.8% in 2023.
- Rent burden worsened in 92 of the 100 largest metros from 2019 to 2023.
- All 25 of the largest metros saw rent burden rates increase between 2019 and 2023.
- Rents grew faster than incomes in 82 of the 100 largest metros from 2019 to 2023.
- Fresno and Riverside, CA, rank in the top 10 metros for rent burden despite relatively lower housing costs due to lagging local incomes.
- Des Moines, IA, has the lowest rent burden, but even there, 43% of renters struggle with excessive rent costs.
- San Jose, CA, has one of the lowest rent burdens despite the nation’s highest median rents, thanks to high local salaries.
Conclusion
The U.S. rental market has undergone many shifts, shaped by economic volatility, shifting migration patterns, and evolving renter expectations. Though rent growth has tempered in recent years, affordability remains an increasingly urgent concern. In recent years, a record number of renters found themselves cost-burdened, allocating more than 30% of their income to housing—a stark reminder that stability remains elusive for millions. As demand for rental housing persists, the challenge ahead is not just expanding supply but ensuring that affordability is more than an aspiration.
- Source: Apartment List Rent Estimates↩
- Source: Apartment List Renter Migration Report: 2025↩
- Source: ValuePenguin↩
- Source: Insurance Information Institute↩
- Source: Apartment List Data & Rent Estimates↩
- Source: John Burns Research and Consulting↩
- Source: Pew Research Center↩
- Source: Harvard University↩
- Source: Pew Research Center↩
- Source: U.S. Census Bureau, American Community Survey Table B25118↩
- Source: U.S. Census Bureau, American Community Survey Table B25007↩
- Source: U.S. Census Bureau, American Community Survey Table B17019↩
- Source: Apartment List Vacancy Rates↩
- Source: How Much Are Utilities in an Apartment?↩
- Source: St. Louis Federal Reserve Economic Data (FRED), Series ERNTOCCUSQ176N↩
- Source: U.S. Bureau of Labor Statistics, Housing Leases In the U.S. Rental Market↩
- Source: The Journalist's Resource↩
- Source: AB-1482 Tenant Protection Act of 2019↩
- Source: New York Times↩
- Source: NYC Comptroller↩
- Source: Texas State Law Library↩
- Source: Arizona State University↩
- Source: 2024 Tennessee Code Title 66↩
- Source: GAP↩
- Source: GAP↩
- Source: Harvard University↩
- Source: CBPP↩
- Source: CBPP↩
- Source: Harvard University↩
- Source: Harvard University↩
Share this Article